This site uses cookies to improve your experience. To help us insure we adhere to various privacy regulations, please select your country/region of residence. If you do not select a country, we will assume you are from the United States. Select your Cookie Settings or view our Privacy Policy and Terms of Use.
Cookie Settings
Cookies and similar technologies are used on this website for proper function of the website, for tracking performance analytics and for marketing purposes. We and some of our third-party providers may use cookie data for various purposes. Please review the cookie settings below and choose your preference.
Used for the proper function of the website
Used for monitoring website traffic and interactions
Cookie Settings
Cookies and similar technologies are used on this website for proper function of the website, for tracking performance analytics and for marketing purposes. We and some of our third-party providers may use cookie data for various purposes. Please review the cookie settings below and choose your preference.
Strictly Necessary: Used for the proper function of the website
Performance/Analytics: Used for monitoring website traffic and interactions
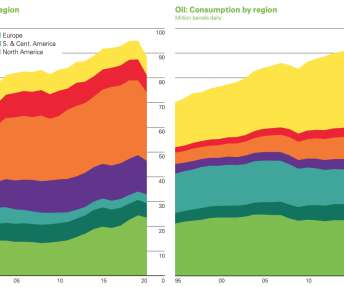
bp released the 70 th annual edition of the bp Statistical Review of World Energy ; the data collected in this year’s edition includes energy data for 2020. The Review captures the significant impact the global pandemic had on energy markets and how it may shape future global energy trends.
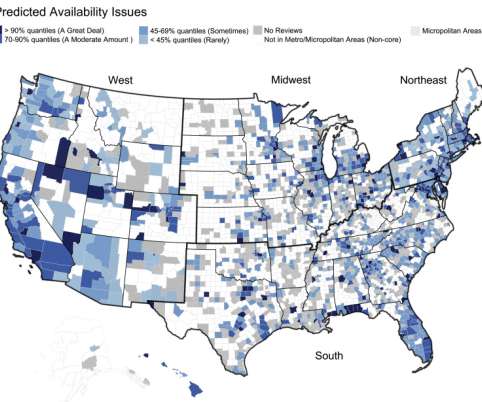
Predicted discussion frequency of station availability for US metropolitan and micropolitan statistical areas. The map reveals areas with high and low discussion frequency for predicted Availability issues in all metropolitan statistical areas (e.g., Micropolitan statistical areas (e.g., Micropolitan statistical areas (e.g.,
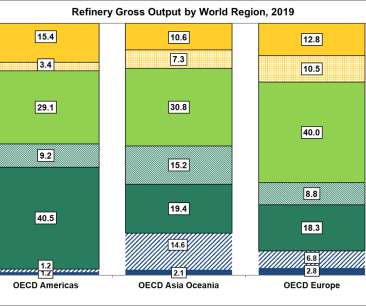
The International Energy Agency’s Monthly Oil Statistics shows that there are differences in refinery output throughout the world. Source: International Energy Agency, Monthly Oil Statistics, February 2020, Paris, France., When processing petroleum, refineries can produce products in varying amounts to meet regional demands.
Bureau of Transportation Statistics (revenue passenger miles). Bureau of Labor Statistics (Consumer Price Index). Energy Information Administration (price of gasoline). Federal Highway Administration (vehicle miles traveled). Census Bureau (population).
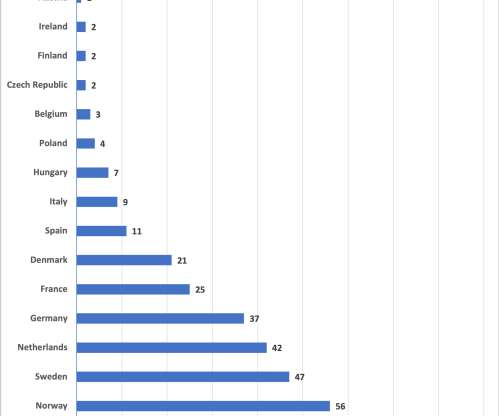
New statistics show that Volvo Trucks was the market leader for heavy all-electric trucks in Europe 2021 with a market share of 42%. Statistics from the market analysis group IHS Markit show that during 2021 a total of 346 electric trucks (?16 An increasing number of heavy all-electric trucks are now running in commercial traffic.
Source: US Department of Transportation, Bureau of Transportation Statistics and Federal Highway Administration, Freight Analysis Framework, version 4.5.1, billion tons were shipped between 100 and 249 miles and 1.2 billion tons between 250 and 499 miles.
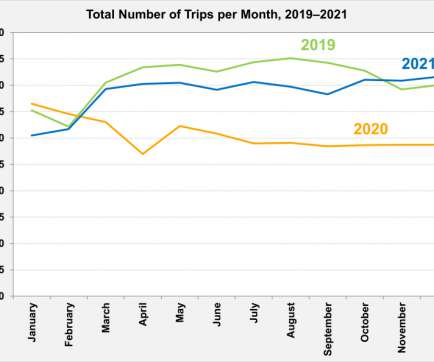
A research study for the Bureau of Transportation Statistics focused on the number of daily trips taken in the United States. Source: Estimated for the Bureau of Transportation Statistics by the Maryland Transportation Institute and Center for Advanced Transportation Technology Laboratory at the University of Maryland.
The post Tesla publishes astonishing FSD safety statistics appeared first on TESLARATI. Shoot me an email at william@teslarati.com. You can also reach me on Twitter @ WilliamWritin. If you have news tips, email us at tips@teslarati.com !
New data from the UK shows an increase in retailers stocking used electric vehicles, signs of market confidence, and many other revealing statistics that debunk myths about EVs. Electric vehicle misinformation is rampant in the media, but it doesn’t show the reality of the electric vehicle marketplace.
The bp Statistical Review of World Energy is a venerable survey of the world’s energy production and consumption — the oil giant has been publishing it yearly since 1952. It’s an extremely detailed report — it lists the amounts of energy generated and consumed, as well as the means of generation, for just about every country […].
Source: US Department of Transportation, Bureau of Transportation Statistics and Federal Highway Administration, Freight Analysis Framework Version 5.5, Resources Contains only shipments associated with domestic freight moved between domestic origins and domestic destinations. Data Tabulation Tool.
However, the starting year of this analysis is 1966 because (1) for 1923 through 1935, fuel-economy information is available only for the entire fleet of all vehicles, and (2) from 1936 through 1965, light trucks were included with other trucks in the relevant statistics.?. Annual statistics from the U.S. Department of Transportation.
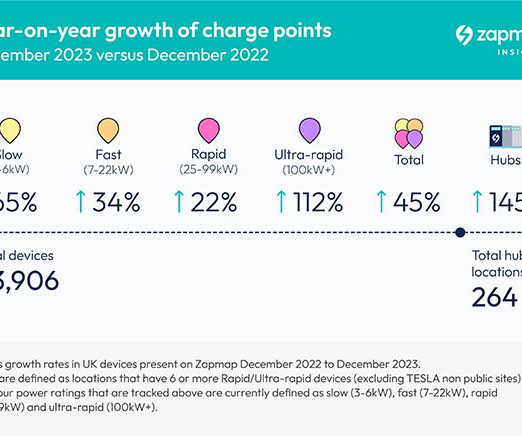
The figures show another year of record growth in the number of charge points installed across the UK over the past 12 months, with the highest growth being seen in ultra-rapid (150kW+) devices and charging […] The post Zapmap releases 2024 EV charging statistics revealing record rate of charge point installation appeared first on Electric Cars (..)
In a paper published in the journal Fuel , the team reported: No statistically significant fuel effect on nitrogen oxide (NO x ) emissions for E15. Total hydrocarbons (THC), non-methane hydrocarbons (NMHC), and carbon monoxide (CO) showed either marginally or statistically significant reductions for E15.
Department of Transportation, Federal Highway Administration, Highway Statistics 2017, August 2018, Table VM-2. Note: Highway vehicle VMT includes all vehicle travel on highways, streets, and local roads. Values rounded to the nearest hundred miles. Sources: VMT – U.S. Resident population – U.S.
According to the operational statistics, electric buses today are the most reliable type of surface public transport. Moscow continues to adapt infrastructure and urban transport in accordance with the Green Agenda. Moscow’s eco-friendly transport fleet is considered to be the largest in Europe.
Source: US Department of Transportation, Bureau of Transportation Statistics and Federal Highway Administration, Freight Analysis Framework Version 5.5, Contains only shipments associated with domestic freight moved between domestic origins and domestic destinations.
Bureau of Labor Statistics. Given the sizes of the standard errors, none of the three variables of interest showed a statistically significant difference between 2007 and 2017. This analysis examined whether one can discern any influence of the growth of e-commerce on the amount of travel. ATUS is an annual time-diary study by the U.S.
Recent data from the Bureau of Transportation Statistics presented by the US Department of Energy (DOE) showed that in November of 2021, the number of daily trips taken nationwide exceeded the number of trips taken in late 2019, before the pandemic significantly affected daily travel across the United States.
However, the starting year of this analysis is 1966 because (1) for 1923 through 1935, fuel-economy information is available only for the entire fleet of all vehicles, and (2) from 1936 through 1965, light trucks were included with other trucks in the relevant statistics.?. Annual statistics from the U.S. Department of Transportation.
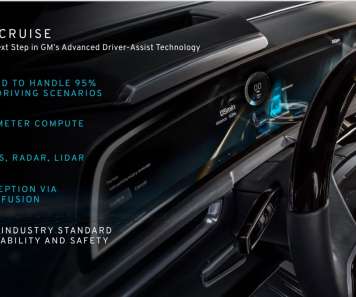
Ultra Cruise works through a combination of cameras, radars and LiDAR, developing accurate, 360-degree, three-dimensional statistical representations of the environment surrounding vehicles with redundancies in critical areas. The app will provide more centrally located information, including driver’s statistics, trips and history.
The plug-in hybrid receives an MMI display with electric-specific driving screens, including charging information, and additional consumption statistics to help drivers maximize the efficiencies of the hybrid system. The Audi virtual cockpit is also updated to display battery data and range statistics.
The calculated average passenger-distances traveled per person are shown in the table below, along with the average occupancy rates from the Bureau of Transportation Statistics. Furthermore, the focus here is not on total distances but on distances per person, because the U.S. population increased by 57% during the period studied.
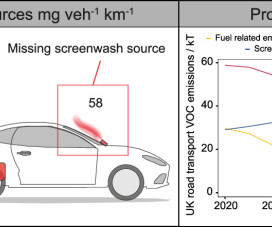
Scaling of industry sales statistics enabled the discrepancy to be attributed to the use of ancillary solvent products such as screenwash and deicer which are not included in internationally applied vehicle emission methodologies. While some VOCs are released in exhaust, others may arise from an unexpected source—e.g.,
Other pieces of the puzzle, […] The post New EV charging statistics reveal record rate of charge point installation in 2023 appeared first on Electric Cars Report.
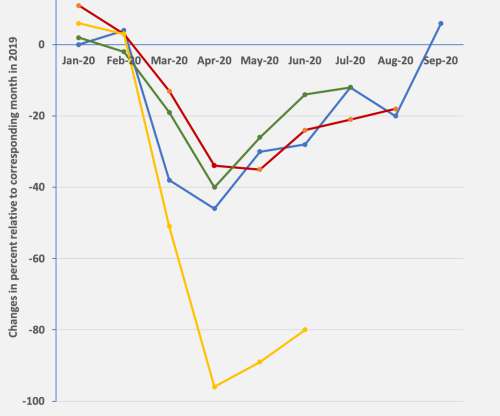
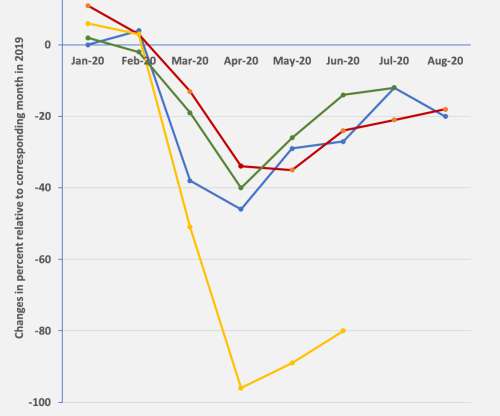
US airlines carried 89% fewer scheduled service passengers in May 2020 than in May 2019, according to preliminary data filed with the Bureau of Transportation Statistics (BTS) by 20 airlines that carry more than 90% of the passengers. Source: DOT BTS.
Bureau of Transportation Statistics.) Specifically, of interest here is the number of fatalities in each of the two transportation modes during a 10-year period from 2010 through 2019. The raw data came from the U.S. Department of Transportation and the U.S. The results are shown in the table below.
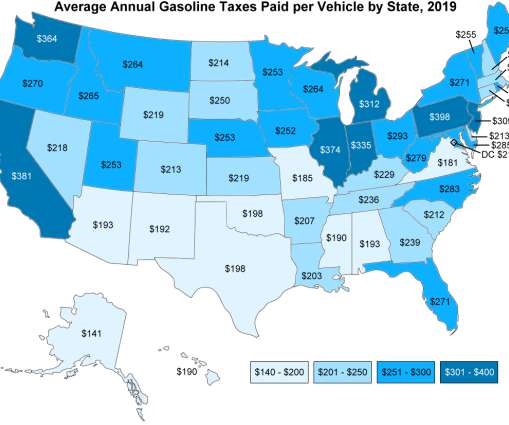
Department of Transportation, Federal Highway Administration, Highway Statistics 2017, Table VM-1; and tax data by state from the U.S. Source: Calculated by Oak Ridge National Laboratory using average annual miles and average fuel economy of the light-duty vehicle population from the U.S.
Charger Connect / Pro, Volkswagen’s smart wallbox for home charging, access to additional useful online services such as charging statistics, access management or remote control. Furthermore, We Charge gives users of the ID.
Bureau of Transportation Statistics (revenue passenger miles). Bureau of Labor Statistics (Consumer Price Index). Energy Information Administration (price of gasoline). Federal Highway Administration (vehicle miles traveled). Census Bureau (population).
The test fleet showed statistically significant effects for some pollutants, but not for others. NO x emissions, a target pollutant of concern for this program, did not show any statistically significant difference between the fuels for the FTP nor for each individual FTP phase.
They used statistical and data analysis methods including sparse regression and neural networks to compare the behavior of these parameters temporally and between the two fuel types. Among their findings: Although differences in the performance metrics were statistically significant, the magnitude of these differences were minimal.
These, through a new dedicated smartphone application, offer users at launch, among other things, adaptive electrical assistance, an anti-theft system, an alarm, bike geolocation, real-time navigation, destination weather forecasts, and route statistics.
The tolerance values—conformity factors (CF)—had been set by the European Commission in order to take into account the technical and statistical inaccuracies of the RDE measurements. Thus, for Euro 6 diesel vehicles, a NO x limit of 80 mg / km was established for the test bench measurements.
Department of Transportation, Federal Highway Administration, Highway Statistics 2017, Washington, DC, March 2019, Table VM-1. Single-unit trucks were 3% of the truck population and 3% of VMT, while making up 9% of vehicle fuel use. Source: U.S.
Data from the Bureau of Labor Statistics’ Consumer Expenditures Survey show that spending on vehicle repair and maintenance has also increased in recent years. Overall, the aging of the vehicle fleet suggests many households have delayed purchasing a new vehicle or have instead purchased a used vehicle.
For comparison, global final electricity consumption was just over 22,300 terawatt-hours in 2018, the most recent year for which statistics are available, according to the International Energy Agency. Those figures do not include the amount generated from hydropower. This is really optimistic.
Gasoline consumption per capita was calculated using the population estimates in the ProQuest Statistical Abstract of the United States. Total consumption (millions of gallons). Consumption per capita. Consumption per capita dropped from 414 gallons in 2019 to 356 gallons in 2020, again a drop of 14%.
Federal Highway Administration (FHWA) statistics show that more than 1 in 5 annual motor vehicle crashes—many involving injuries and fatalities—are weather-related. The report, Automated Vehicles and Adverse Weather: Final Report , explores AV needs, opportunities, and potential shortcomings during adverse weather conditions.
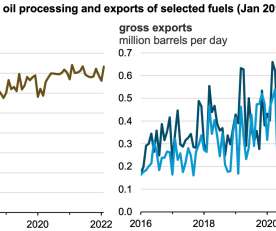
According to China’s National Bureau of Statistics, China processed a record 14 million barrels per day (b/d) of crude oil in 2021, a 4.6% Source: Graph by the U.S. Energy Information Administration, based on data from China General Administration of Customs, as compiled by Bloomberg, L.P. increase from 2020.
The data and equipment settings are constantly verified against a statistical baseline of normal voltage, frequency, breaker status and power quality. The approach uses tamper-resistant blockchain to spread configuration and operational data redundantly across multiple servers. Grid Guard attestation framework and Anomaly Detection Module.
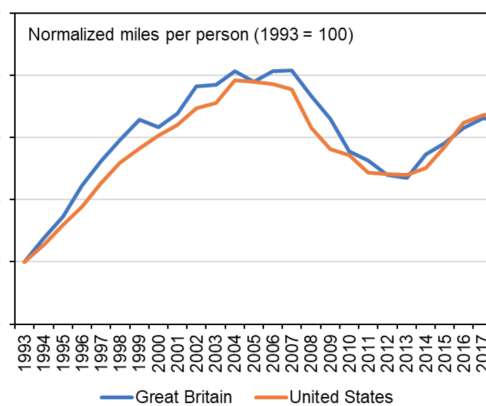
statistics segment road vehicles differently, the data are for all road vehicles. (I Office for National Statistics (populations). The issue of interest in this study is whether, despite this difference, the two countries show similar patterns of recent changes on this measure. The years examined were 1993 through 2018.
The new and used-vehicle CPI are calculated by the Bureau of Labor Statistics using consumer transaction prices from surveys of new-vehicle dealerships and the NADA Official Used Car Guide. Used-vehicle prices were more volatile than new-vehicle prices over the period from 1970 to 2018 and used-vehicle sales are more variable as well.
For their statistical analyses, the researchers made use of anonymized data that vehicle drivers had voluntarily reported to online portals such as Spritmonitor in Germany and MyMPG in the United States. Statistically, private users of vehicles in Germany re-charge their plug-in hybrid vehicle only on three out of four days.
We organize all of the trending information in your field so you don't have to. Join 5,000+ users and stay up to date on the latest articles your peers are reading.
You know about us, now we want to get to know you!
Let's personalize your content
Let's get even more personalized
We recognize your account from another site in our network, please click 'Send Email' below to continue with verifying your account and setting a password.


Let's personalize your content