This site uses cookies to improve your experience. To help us insure we adhere to various privacy regulations, please select your country/region of residence. If you do not select a country, we will assume you are from the United States. Select your Cookie Settings or view our Privacy Policy and Terms of Use.
Cookie Settings
Cookies and similar technologies are used on this website for proper function of the website, for tracking performance analytics and for marketing purposes. We and some of our third-party providers may use cookie data for various purposes. Please review the cookie settings below and choose your preference.
Used for the proper function of the website
Used for monitoring website traffic and interactions
Cookie Settings
Cookies and similar technologies are used on this website for proper function of the website, for tracking performance analytics and for marketing purposes. We and some of our third-party providers may use cookie data for various purposes. Please review the cookie settings below and choose your preference.
Strictly Necessary: Used for the proper function of the website
Performance/Analytics: Used for monitoring website traffic and interactions
Ozone levels across much of North America and Europe dropped significantly between 2000 and 2014. People living in parts of southern Europe, South Korea and southern Japan and China also experienced more than 15 days a year of ozone levels above 70 ppb. Trends in daily maximum ozone levels (known as 4MDA8) at urban and non-urban sites.
A new statistical method developed by researchers at KAUST (King Abdullah University of Science and Technology, Saudi Arabia) can detect abnormal ozone levels within large bodies of monitored data. Ozone is the reactive form of oxygen that contains three atoms per molecule (O 3 ) rather than the normal two. Khadraoui, S. &
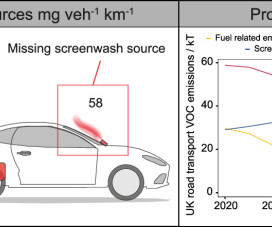
Scaling of industry sales statistics enabled the discrepancy to be attributed to the use of ancillary solvent products such as screenwash and deicer which are not included in internationally applied vehicle emission methodologies. While some VOCs are released in exhaust, others may arise from an unexpected source—e.g.,
The results, published in an open-access paper in the journal Science , suggest that the focus of efforts to mitigate ozone formation and toxic chemical burdens need to be adjusted, the authors suggested. Total VOC emission factors for end uses of petrochemical sources in the study. 1A) and sales data of volatile chemical products.
Major sources of combustion-related emissions in urban areas are transportation, power generation, and industrial processes. It is also a precursor to the formation of ground-level ozone and particulate matter, and as a cause of acid rain.
The found that three of the urban form metrics (contiguity, circularity, and vegetation) have a statistically significant relationship with urban NO 2 ; their combined effect could be substantial. Cities serve as economic and social centers, concentrating people, activities, ideas, and industries. is attributable to motor vehicles.
They found that levels of pollutants that can contribute to the formation of ground-level ozone, or smog, have failed to continue a fairly steady decline as estimated by the US Environmental Protection Agency. These results show that meeting future air quality standards for ozone pollution will be more challenging than previously thought.
The increase in anthropogenic emissions comes directly from energy supply (47%); industry (30%); transport (11%); and buildings (3%) sectors, the WG reported with medium confidence. industrial levels) include substantial cuts in anthropogenic GHG emissions by mid?century GtCO 2 eq/yr in 2010. century through large?scale
Using statistical methods, the scientists infer emissions from these data within a radius of about one kilometer of the measurement location. We continuously measure the concentration of carbon dioxide, nitrogen oxide and volatile organic compounds at our urban observatory in Innsbruck. We record 36,000 data points per hour.
The largest systematic study ever conducted of human volunteers exposed to ozone air pollution has found no evidence of effects on the heart in its healthy, older participants, but did find effects on the volunteers’ ability to breathe, even at low ambient levels. Possible pathways by which ozone may cause adverse health effects.
The researchers used exposure data from a model that simulates atmospheric chemical processes and the way they interact with land, sea and chemicals emitted from natural and man-made sources such as energy generation, industry, traffic and agriculture. They focused particularly on PM 2.5 Jos Lelieveld, Thomas Münzel et al.
The largest sources of air pollution are not industry and transport but small domestic fires and agriculture. In the EU exposure to fine particles and ozone claims 180,000 lives a year, including 35,000 in Germany. Other major sources are fossil-fuel fired power plants, industry, biomass combustion and motor vehicles.
China enters world markets as major exporter of industrial products. For example, when China entered world markets as a major exporter of industrial products, production from less productive firms in Mexico was reduced or ceased altogether, thus diverting resources to more productive uses.
Ambient air pollution is a mixture of particulate matter (PM) and gaseous pollutants such as sulfur dioxide (SO 2 ), nitric dioxide (NO 2 ) and ozone (O 3 ). and NO 2 originate predominantly from the combustion of fossil fuels such as emissions from industrial plants or vehicles.
We organize all of the trending information in your field so you don't have to. Join 5,000+ users and stay up to date on the latest articles your peers are reading.
You know about us, now we want to get to know you!
Let's personalize your content
Let's get even more personalized
We recognize your account from another site in our network, please click 'Send Email' below to continue with verifying your account and setting a password.


Let's personalize your content