Remove Energy Remove Gasoline Remove Oil Remove Statistics
article thumbnail

EIA: China processed record amounts of crude oil in 2021 but exported less gasoline and diesel

Green Car Congress

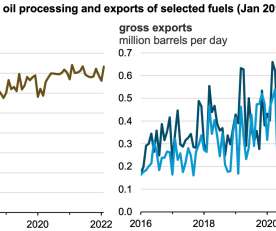
China processed record amounts of crude oil in 2021 to meet rising domestic consumption of petroleum products, according to analysis by the US Energy Information Administration (EIA). Energy Information Administration, based on data from China General Administration of Customs, as compiled by Bloomberg, L.P. increase from 2020.

Oil 370
article thumbnail

MIT/UC Davis professors challenge claims that ethanol production decreased gasoline prices in 2010 and 2011

Green Car Congress

Knittel/Smith results for implied gasoline price effects from elimination of ethanol for 2010 using Du/Hayes model and pooled-sample estimates. t margin for oil refiners. Because ethanol production increased smoothly during the sample period, statistical analysis with this variable is fraught with danger. Click to enlarge.

Davis 334
article thumbnail

Actual fuel economy of cars and light trucks: 1966-2019

Green Car Congress

However, the starting year of this analysis is 1966 because (1) for 1923 through 1935, fuel-economy information is available only for the entire fleet of all vehicles, and (2) from 1936 through 1965, light trucks were included with other trucks in the relevant statistics.?. Annual statistics from the U.S. Department of Transportation.

article thumbnail

BP Statistical Review finds global oil share down for 12th year in a row, coal share up to highest level since 1969; renewables at 2%

Green Car Congress

World primary energy consumption grew by 2.5% Oil remains the world’s leading fuel, but its 33.1% Global energy consumption grew by 2.5% seen in 2010, according to the newly released BP Statistical Review of World Energy, 2012. Global energy consumption grew by 2.5% in 2011, close to the historical average.

Coal 261
article thumbnail

Actual fuel economy of cars and light trucks: 1966-2017

Green Car Congress

However, the starting year of this analysis is 1966 because (1) for 1923 through 1935, fuel-economy information is available only for the entire fleet of all vehicles, and (2) from 1936 through 1965, light trucks were included with other trucks in the relevant statistics.?. Annual statistics from the U.S. Department of Transportation.

article thumbnail

The electricity in gasoline

Plugs and Cars

Source: Energy Statistics Database | United Nations Statistics Division ) The US is, hoorah, #1. And that doesn't include the electricity used in oil extraction and pumping. I just ran across the latest available data, from 2005, for the electricity consumption by petroleum refineries. Almost 49,000,000,000 kWh.

article thumbnail

UK ONS report finds significant challenge remains to reduce road transport emissions; sector GHG emissions up 6% from 1990-2017

Green Car Congress

A new report by the UK’s Office for National Statistics (ONS) finds that greenhouse gas (GHG) emissions from road transport in the UK rose by 6% from 1990 to 2017. Diesel use exceeded gasoline use from 2005 onwards. Source: Office for National Statistics – UK Environmental Accounts, Energy Use datasets.

2017 191