This site uses cookies to improve your experience. To help us insure we adhere to various privacy regulations, please select your country/region of residence. If you do not select a country, we will assume you are from the United States. Select your Cookie Settings or view our Privacy Policy and Terms of Use.
Cookie Settings
Cookies and similar technologies are used on this website for proper function of the website, for tracking performance analytics and for marketing purposes. We and some of our third-party providers may use cookie data for various purposes. Please review the cookie settings below and choose your preference.
Used for the proper function of the website
Used for monitoring website traffic and interactions
Cookie Settings
Cookies and similar technologies are used on this website for proper function of the website, for tracking performance analytics and for marketing purposes. We and some of our third-party providers may use cookie data for various purposes. Please review the cookie settings below and choose your preference.
Strictly Necessary: Used for the proper function of the website
Performance/Analytics: Used for monitoring website traffic and interactions
The 2022 FuelEconomy Guide, released by ORNL for the DOE/EPA fueleconomy.gov website, provides up-to-date information on fueleconomy, environmental and safety data, so consumers can choose the most fuel-efficient vehicle that meets their needs. Credit: Andrew Sproles/ORNL, U.S.
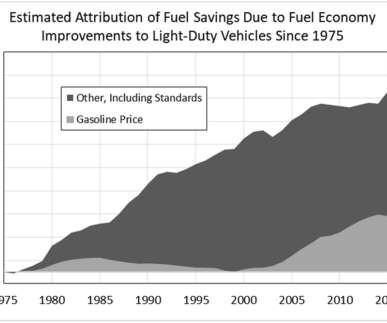
A team from the University of Tennessee and the National Renewable Energy Laboratory (NREL) has the fuel savings due to fueleconomy improvements over the past 43 years amount to approximately two trillion gallons of gasoline. Also since 1975, light-duty vehicle travel increased by 134% while fuel use increased by only 37%.
The US Environmental Protection Agency (EPA) and the US Department of Transportation (DOT) formally unveiled their joint proposal to set stronger fueleconomy and greenhouse gas pollution standards for Model Year 2017-2025 passenger cars and light trucks. The 163 g/mile limit would be equivalent to 54.5 mpg US (5.87
Improving fueleconomy exhibits diminishing returns in fuel savings, according to a brief analysis by the US Energy Information Administration (EIA). Similarly, the fuel and cost savings of improving fueleconomy from 12 mpg to 15 mpg are the same as increasing from 30 mpg to 60 mpg.
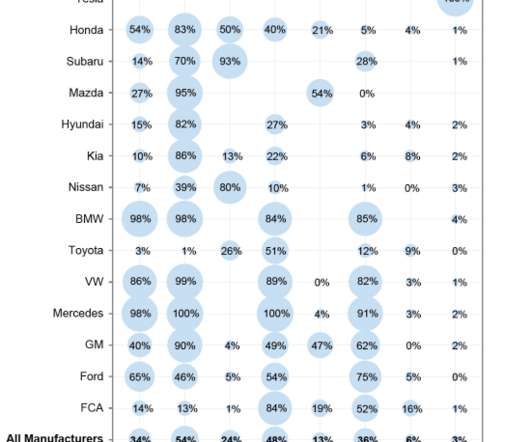
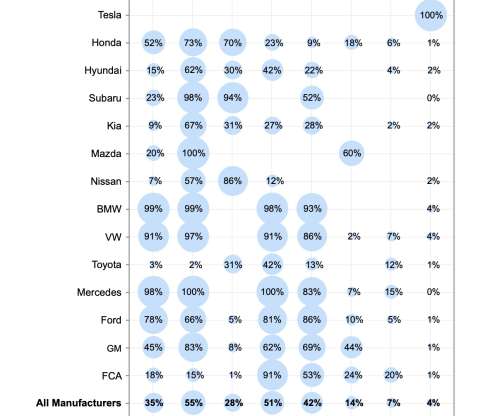
With alternative fuel vehicles now approaching 1% of new vehicle production, however, they are in fact beginning to have a “ measurable and meaningful impact ” on overall new vehicle fueleconomy and CO 2 emissions. In the analysis, EPA uses overall fueleconomy in mpg equivalent (mpge) and tailpipe CO 2 emission values.
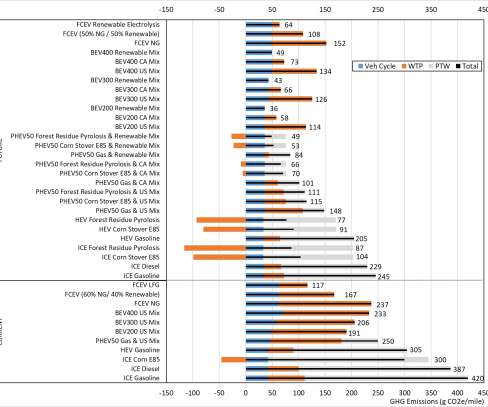
C2G emissions are a sum of WTW emissions and emissions associated with vehicle manufacturing. Using current technologies, all evaluated biofuel, battery electric, and hydrogen fuel cell vehicle pathways offer significant C2G GHG emissions reduction compared to the current gasoline internal combustion engine vehicle.
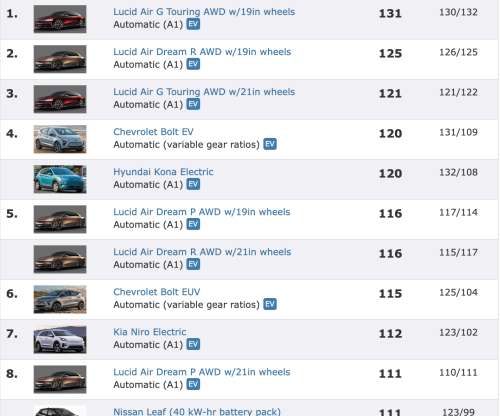
The 2013 Honda Fit EV ( earlier post ) received a combined adjusted Environmental Protection Agency (EPA) mile-per-gallon-equivalency (MPGe) rating of 118 MPGe—the highest yet awarded by the EPA. City and highway cycle fuel-economy ratings are 132 and 105 MPGe, respectively. Honda Fit EV Efficiency Comparison. Nissan Leaf.
The latest edition of the US Environmental Protection Agency (EPA) annual Automotive Trends Report finds that Model Year (MY) 2017 vehicle fueleconomy was 24.9 miles per gallon, slightly higher than MY 2016, and a record high overall. Since MY 2004, fueleconomy and CO 2 emissions have improved in eleven out of thirteen years.
If balanced to meet an overall GHG reduction goal, sufficiently aggressive policy goals would result in the following deviations from the baseline scenario in 2050: a 9-21% reduction in VMT (down to 4000-4700 billion miles per year), a 100-340% increase in new LDV FE (up to 65-110 mpgge), and a 65-77% reduction in FCI (down to 22- 35 gCO 2 e/MJ).
Fuels market analyst Tammy Klein notes that more than 40 countries are developing light-duty vehicle fueleconomy standards. Ten years ago, only four governments 10 years ago had introduced mandatory GHG emission and/or fueleconomy standards: China, Japan, South Korea, and the United States.
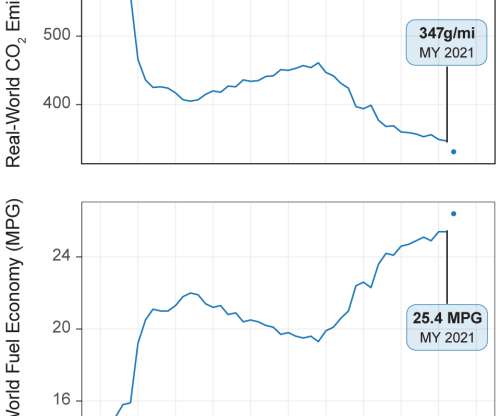
The US Environmental Protection Agency (EPA) released its annual Automotive Trends Report , which shows that model year (MY) 2021 vehicle fueleconomy remained at a record high—but flat with MY 2020 fueleconomy—while CO 2 emission levels reached a new record low. Source: EPA. Source: EPA.
In 2018, 27% of new light-duty vehicles sold in the US had fueleconomies of more than 30 miles per gallon (783 l/100 km), according to the US Department of Energy (DOE). By contrast, none of the light-duty vehicles produced in 1975 had fueleconomy greater than 30 miles per gallon (mpg). In 1995, 4.4%
In the US, Model Year (MY) 2018 vehicle fueleconomy was 25.1 miles per gallon, 0.8% miles per gallon MY 2017, according to the annual Automotive Trends Report released by the US Environmental Protection Agency (EPA). Since MY 2004, CO 2 emissions have decreased 23%, or 108 g/mi, and fueleconomy has increased 30%, or 5.8
Preliminary data in EPA’s 2020 Automotive Trends Report shows average fueleconomy for model year 2020 light-duty vehicles increased to 25.7 miles per gallon (MPG). If this preliminary data holds, that will be a new record high for average new light-duty vehicle fueleconomy. Fueleconomy decreased by 0.2
In the US Energy Information Administration’s Annual Energy Outlook 2014 (AEO2014) Reference case, more-stringent vehicle fueleconomy standards contribute to a decline in motor gasoline consumption through 2040. The Reference case projects an increase in VMT that, all else equal, would increase motor gasoline fuel consumption.
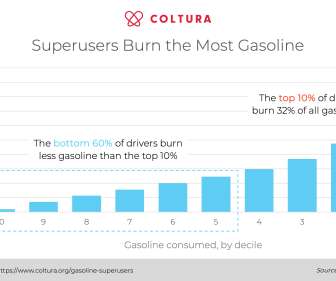
Gasoline superusers drive three times more miles than the average driver (30,348 miles per year, compared to 8,698), are more likely to drive pickups and SUVs, and are more likely to live in rural areas. Consumption would be calculated by using total miles driven by the current owner, years owned, and the EPA fueleconomy rating.
The US Environmental Protection Agency (EPA) and the Department of Energy (DOE) are releasing the 2014 FuelEconomy Guide, providing consumers with a resource to identify and choose the most fuel efficient and low greenhouse gas emitting vehicles that meet their needs.
EPA released the latest edition of its annual report on trends in CO 2 emissions, fueleconomy and powertrain technology for new personal vehicles in the US. Fueleconomy has now increased in eight of the last nine years; average carbon dioxide emissions are also at a record low of 369 g/mile in model year 2013.
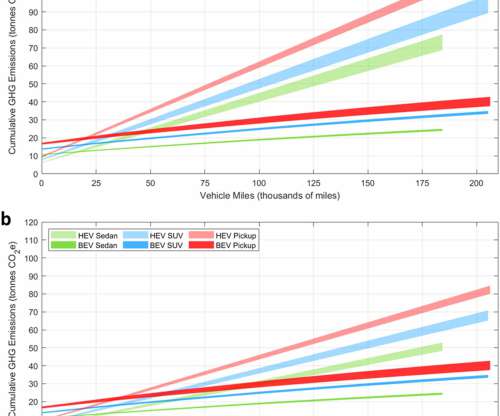
Light-duty vehicles, including sedans, SUVs, and pickup trucks, are currently responsible for 58% of US transportation sector emissions. In an open-access paper in Environmental Research Letters , they show that the proportional emissions benefit of electrification is approximately independent of vehicle class. Woody et al.
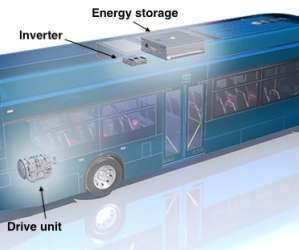
The eGen Flex system—comprising the drive unit, inverter and rechargeable energy storage system—includes full electric drive capability for up to 10 miles, depending upon duty cycle and accessory load demands. —Rohan Barua, Vice President of Sales, North America at Allison Transmission.
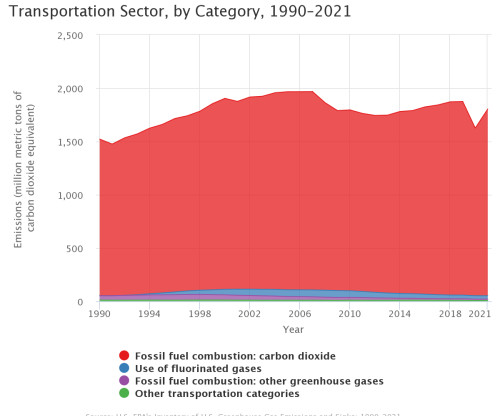
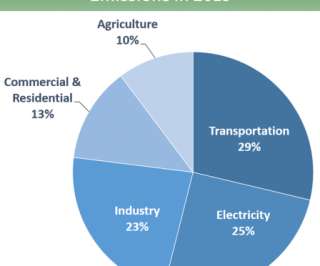
The US Environmental Protection Agency (EPA) released its 30 th annual Inventory of US Greenhouse Gas Emissions and Sinks (GHG Inventory), which presents a national-level overview of annual greenhouse gas emissions from 1990 to 2021. In 2021, US greenhouse gas emissions totaled 6,340.2 GHG emissions by economic sector.
PM mass emissions rates for the FTP and US06 drive cycles as function of vehicle mileage. 2021) over a 150,000-mile vehicle lifetime, but that further work must be done to address achieving the more stringent 1 mg/mi target (LEV III in 2025). fuel injection timing, number of injections, fuel pressure, injector placement, etc.)
The all-electric vehicle range of the 2013 Chevrolet Volt will increase by three miles from the 2012 model to be 38 miles on a single charge. The miles per gallon equivalent (MPGe) fueleconomy will increase from 94 miles to 98 miles and the total range, including extended range operation, will be 380 miles.
Researchers at the MIT Joint Program on the Science and Policy of Global Change have compared the worldwide economic, environmental, and energy impacts of currently planned fueleconomy standards (extended to the year 2050) with those of region-specific carbon prices designed to yield identical CO 2 emissions reductions.
Standard fuel consumption is 4.2 liters per 100 km (56 mpg US), which translates into CO 2 emissions of 110 g/km (177 g/mile). seconds; top speed is 250 km/h (155 mph); fuel consumption of 6.8 liters per 100 km (35 mpg US ) and CO2 emissions of 159 g per km (256 g/mile). The Audi TT 2.0
According to its initial assessment, XL is reporting that the XLP F-250 truck will provide up to a 50% improvement in miles driven per gallon (MPG) over conventional factory units, while reducing greenhouse gas (GHG) emissions by 33% during normal operation.
Top: Gravimetric PM mass, PM mass calculated based on the IPSD method, black carbon, and EC/OC emissions over the LA92 cycle. Bottom: Total particle-phase PAH emissions, expressed in ng/mile, for both test vehicles over the LA92 cycle. LEVIII will begin a four year phase-in of a tighter 1 mg/mile starting in 2025.
l/100 km) in 2016, the The ICCT team assessed increased consumer label fueleconomy (as opposed to the regulatory test fueleconomy) to 35 mpg (6.71 l/100 km) in 2016, the The ICCT team assessed increased consumer label fueleconomy (as opposed to the regulatory test fueleconomy) to 35 mpg (6.71
Although a lightweight steel vehicle has a lower production phase environmental impact, those initial gains are erased by higher energy use and carbon emissions during the steel vehicle’s use phase, the study found. Compared to a lightweight steel vehicle, the breakeven point is at 27,340 miles (44,000 km). Source: Sujit Das, ORNL.
In a US Department of Energy (DOE)-sponsored project, engineers at Cummins are developing a Tier 2 Bin 2 emissions compliant diesel for application in a light duty pickup (ATLAS, Advanced Technology Light Automotive Systems, earlier post ). Fueleconomy targets for the vehicle are 22.4 Tailpipe emissions [g/mile].
Separately, the Accord Hybrid, also featuring Honda’s new two-motor hybrid system, will launch nationwide next summer with anticipated fueleconomy ratings of 49/45/47 city/hwy/combined (4.8/5.2/5.0 The numerical part of the standard category, such as 20 in SULEV20, refers to the emission standard, in thousandths of a gram per mile.
Lightning Hybrids , a maker of hydraulic hybrid systems for medium- and heavy-duty trucks and buses ( earlier post ), released initial results from emissions testing conducted by an independent testing facility in Colorado of two medium-duty trucks upfitted with the Lighting Hybrids system. stops/mile and 17% idle time. mph), low 2.1
However, they also noted, high PTW efficiencies and the moderate fueleconomies of current compressed natural gas vehicles (CNGVs) make them a viable option as well. The study investigated the the WTW energy and emissions from the use of natural gas in CNGVs with a range of CNGV fueleconomy and natural gas compressor efficiency.
Initially, the researchers have focused on the combustion of liquid fuel sprays found in engines, where the extreme pressures and temperatures create an environment that is optically challenging. However, this comes at the cost of higher particulate matter emissions. —Sandia researcher Scott Skeen.
The US Environmental Protection Agency (EPA) and US Department of Transportation’s National Highway Traffic Safety Administration (NHTSA) released their long-expected notice of proposed rulemaking (NPRM) to adjust the Congressionally-mandated Corporate Average FuelEconomy (CAFE) and Light-Duty Vehicle Greenhouse Gas Emissions Standards.
The defect leads to lower fueleconomy, non EPA-compliant emissions levels, and costly and frequent vehicle repairs, the complaint charges. When the SCR system breaks down, the filter gets clogged, requiring more fuel to be injected to burn it off, according to the complaint.
The US Environmental Protection Agency (EPA) released its 28 th annual Inventory of US Greenhouse Gas Emissions and Sinks (GHG Inventory), which presents a national-level overview of annual greenhouse gas emissions from 1990 to 2019. CO 2 emissions decreased 2.2% Total GHG emissions in 2019 were up 1.8% from 2018 to 2019.
Mercedes-Benz is introducing the new E 300 BlueTEC HYBRID; the luxury-class diesel hybrid offers fuel consumption of 4.2 L of diesel/100 km (56 mpg US), with CO 2 emissions of 109 g/km. The E 300 BlueTEC HYBRID is based on the E 250 CDI, yet has a higher output and approximately 15% lower fuel consumption. Earlier post.)
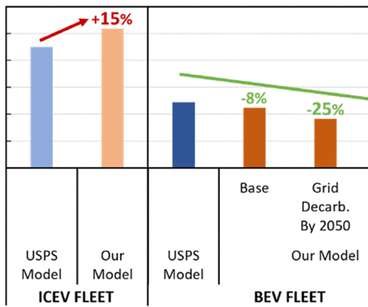
A new University of Michigan study finds that making the switch to all-electric mail-delivery vehicles would lead to far greater reductions in greenhouse gas emissions than previously estimated by the US Postal Service (USPS). An all-electric fleet would reduce lifetime greenhouse gas emissions by 14.7 Earlier post.). Woody et al.
kWh of power, yielding an estimated all-electric range (AER) of 32 miles and estimated fueleconomy of 70 MPGe. The Plug-in Hybrid powerplant delivers power through a PHEV-tuned six-speed automatic transmission for smoothness and efficiency, with an estimated combined fueleconomy rating of 30 mpg with all-wheel drive.
In the latest effort to make aviation sustainable and reduce greenhouse gas emissions, ZeroAvia announced advancements in developing a hydrogen-fueled electric powertrain. These tests confirm the company’s fueleconomy and maximum power delivery targets.
In other words, they found that they real-world fueleconomy benefit of adoption of HEVs may be better than for estimates based on EPA “sticker” fueleconomy alone. There is very little quantitative data on the fuel and emissions benefits of HEVs during real-world driving. The duo, Britt A.
The European Union (EU) recently adopted CO 2 emissions mandates for new passenger cars, requiring steady reductions to 95 gCO 2 /km in 2021. We argue that assessment of the performance of the EU targets and alternatives should account for interactions of the transport sector with other energy sectors and with other parts of the economy.
We organize all of the trending information in your field so you don't have to. Join 5,000+ users and stay up to date on the latest articles your peers are reading.
You know about us, now we want to get to know you!
Let's personalize your content
Let's get even more personalized
We recognize your account from another site in our network, please click 'Send Email' below to continue with verifying your account and setting a password.


Let's personalize your content