This site uses cookies to improve your experience. To help us insure we adhere to various privacy regulations, please select your country/region of residence. If you do not select a country, we will assume you are from the United States. Select your Cookie Settings or view our Privacy Policy and Terms of Use.
Cookie Settings
Cookies and similar technologies are used on this website for proper function of the website, for tracking performance analytics and for marketing purposes. We and some of our third-party providers may use cookie data for various purposes. Please review the cookie settings below and choose your preference.
Used for the proper function of the website
Used for monitoring website traffic and interactions
Cookie Settings
Cookies and similar technologies are used on this website for proper function of the website, for tracking performance analytics and for marketing purposes. We and some of our third-party providers may use cookie data for various purposes. Please review the cookie settings below and choose your preference.
Strictly Necessary: Used for the proper function of the website
Performance/Analytics: Used for monitoring website traffic and interactions
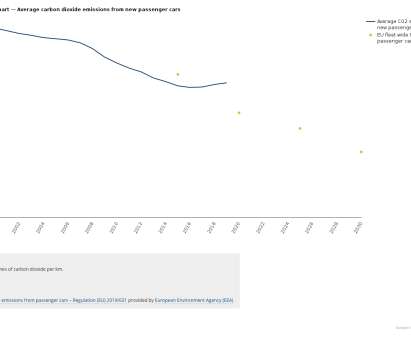
The European Environment Agency (EEA) has published its provisional data about the CO 2 emissions of newly registered passenger cars and vans in Europe in 2020. For cars, the data show a 12% decrease in average cO 2 emissions, compared with 2019. Average van emissions decreased slightly, by about 1.5 %. This was 14.5
According to provisional data published by the European Environment Agency (EEA), the average CO 2 emissions from new passenger cars registered in the European Union (EU) in 2018 increased for the second consecutive year, reaching 120.4 For the first time, the average CO 2 emissions from new vans also increased. g CO 2 /km.
Average emissions from new passenger cars in Europe increased for the third consecutive year in 2019, reaching 122.3?grams CO 2 /km), according to the European Environment Agency’s (EEA) final data. million new cars were registered in 2019 in the EU, Iceland, Norway and the United Kingdom, and about 38% of these were SUVs.
2 -emissions-from-new-cars-vans-2019">According to provisional data published by the European Environment Agency (EEA), average CO 2 emissions from new passenger cars registered in the European Union (EU), Iceland, Norway and the United Kingdom (UK), increased in 2019, for the third consecutive year. g CO 2 /km in total).
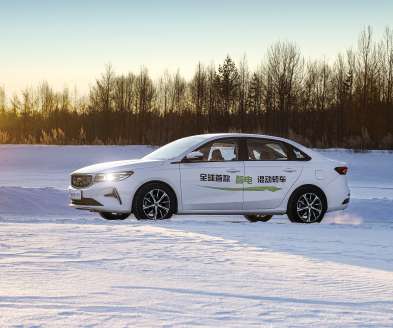
Previous generation methanol vehicles faced difficulties with cold starts but with Geely Auto’s NordThor Power (previously called Leishen Power) hybrid technology and the latest generation methanol powertrains, issues with extreme cold environment performance have been eliminated, the company said. The sedan houses a 1.8L or $4.28).
A new study by the International Council on Clean Transportation (ICCT) estimates heavy fuel oil (HFO) use, HFO carriage, the use and carriage of other fuels, black carbon (BC) emissions, and emissions of other air and climate pollutants for the year 2015, with projections to 2020 and 2025. Click to enlarge. the ICCT team concluded.
The selected projects are located in Bulgaria, Finland, France, Germany, Iceland, the Netherlands, Norway, Poland and Sweden. emissions coming from exhaust gases produced during lime production and store them permanently in offshore geological formations in France. A third project will capture the CO? Background.
Emissions of greenhouse gases from European businesses participating in the EU Emissions Trading System (EU ETS) (cap-and-trade) fell 3.06 % in 2008 compared with a year earlier, according to the information provided by Member State registries. Environment Commissioner Stavros Dimas. With the 6.5% With the 6.5%
PM 10 emissions from road transport in Paris. It complements existing data on emissions from individual industrial plants from the European Pollutant Release and Transfer Register (E-PRTR). NO x emissions from road transport. Click to enlarge. Click to enlarge. Background. Information in the E-PRTR is updated in May each year.
The California Air Resources Board (ARB) released proposed regulations to link its cap-and-trade program to Québec’s to form a joint carbon market to reduce greenhouse gas emissions. —Québec minister for Sustainable Development, Environment and Parks, Pierre Arcand. Earlier post.). South Korea’s program will begin in 2015.
The deadline is fast approaching to apply for the 2021 Keeling Curve Prize , which will award $25,000 to each of 10 projects designed to reduce greenhouse gas emissions or increase carbon uptake. of the International Institute for Environment and Development; Dr. Brenda Ekwurzel, Ph.D.,
None of the EEA scenarios considered delivered the targeted reduction in transport GHG emissions. Based on analysis of long-term trends, a new European Environment Agency (EEA) report calls for a clear vision defining Europe’s transport system by 2050 and consistent policies to achieve it. Click to enlarge.
Indexed European transport sector greenhouse gas emissions, 1990-2006. Transport continues to contribute disproportionally to Europe’s greenhouse gas (GHG) emissions, poor air quality and noise, and still uses the least efficient modes to move people and goods according to a new report from the European Environmental Agency (EEA).
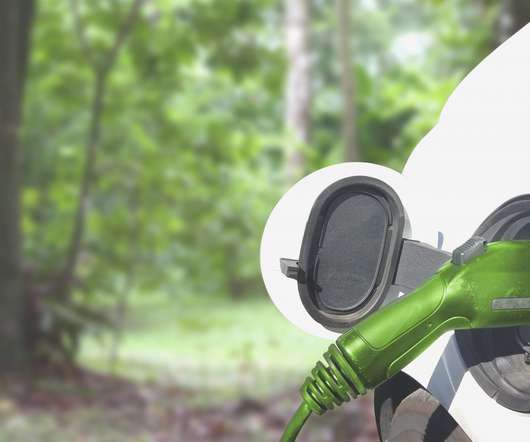
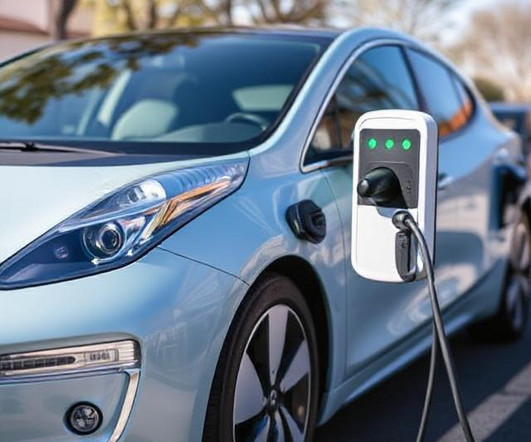
EV MYTH ONE: Manufacturing EVs is just as bad for the environment as ICEVs. It makes sense that during their usable life, electric vehicles are better for the environment than their ICEV counterparts, as they aren’t powered by fossil fuels. Overall, the emissions from the manufacturing of EV parts are about the same or less than ICEVs.
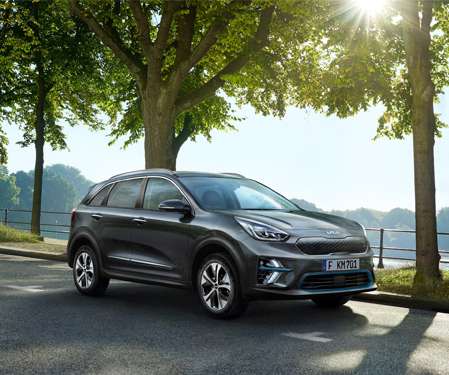
The vehicle’s electric motor develops an output of 100 kW and, with a torque of 290 N·m, the car combines local emission-free mobility with day-to-day suitability and good performance figures. Under H2ME, eight European countries are addressing the actions required to make the hydrogen mobility sector ready for market.
In order for low-cost electricity from coal-fired power plants to remain available, the DOE said, economical methods for capturing and storing the greenhouse gas emissions from these plants must be developed. Planetary Emissions Management Inc. Coal supplies nearly 50% of domestic electricity. Columbia University , New York, N.Y.
EV MYTH ONE: Manufacturing EVs is just as bad for the environment as ICEVs. It makes sense that electric vehicles are better for the environment than their ICEV counterparts, as they aren’t powered by fossil fuels. If it’s manufactured on a ‘dirty’ power grid it becomes a major source of emissions over the EV lifecycle.
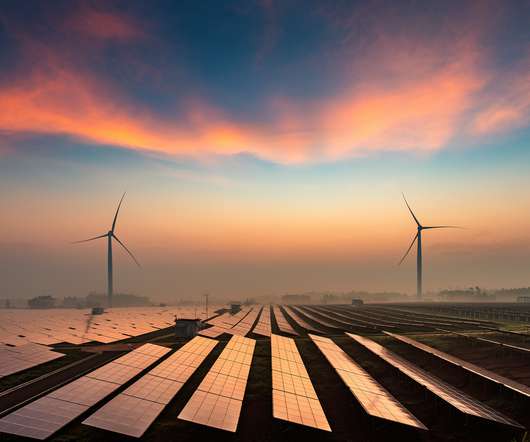
Renewable hydroelectric covers smaller, fast-moving bodies of water where the water flows through the generator’s turbine blades without disturbing the neighboring environment. Iceland, Norway, Canada, Sweden, New Zealand, and Austria were the global leaders in hydroelectric as of 2019. Renewables Depending on the Weather.
Understanding the Carbon Footprint of EVs A vehicle’s carbon footprint includes all greenhouse gas (GHG) emissions associated with its lifecycle: Manufacturing Emissions : Emissions from raw material extraction, battery production, and car assembly. Emissions Per Mile According to the U.S.
Drive Electric Submission: Emissions Reduction Plan Discussion Document. The Emissions Reduction Plan (ERP) has the opportunity to be that plan. E-mobility is an important component to a zero emissions transport system, but is still just a component. . 24 November 2021 . Executive Summary . It’s time to play catch-up.
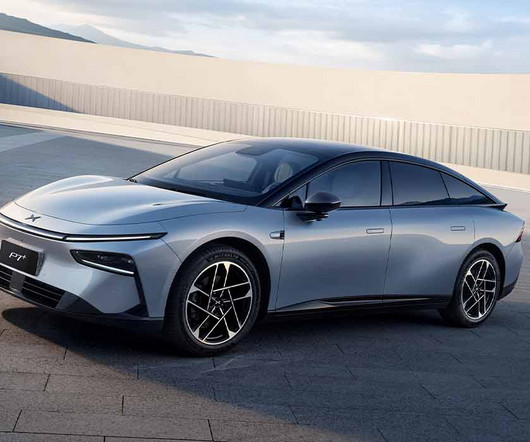
XPENG will continue investing in R&D to expand our vehicle portfolio and bring innovative smart technology to a world with zero accidents, zero traffic congestion, and zero emissions. The spacious interior surpasses the average SUV, with space for 33 carry-on suitcases (with the rear seats folded down).
Considered to be among the harshest and most extreme environments on the planet with low water and nutrient levels paired with high salt and ultraviolet radiation levels, the team seeks to understand how the carbon cycle plays out in this ecosystem. University of Iceland. Community Sequencing Program Sequencing Plans for 2012.
Iceland has so many of these springs naturally, they provide a source of regular energy. EVs are better for the environment than ICE vehicles even when the EV manufacturing process is powered by fossil fuels. Humans have used these outdoor springs for bathing and as a heat source for thousands of years.
We organize all of the trending information in your field so you don't have to. Join 5,000+ users and stay up to date on the latest articles your peers are reading.
You know about us, now we want to get to know you!
Let's personalize your content
Let's get even more personalized
We recognize your account from another site in our network, please click 'Send Email' below to continue with verifying your account and setting a password.


Let's personalize your content