This site uses cookies to improve your experience. To help us insure we adhere to various privacy regulations, please select your country/region of residence. If you do not select a country, we will assume you are from the United States. Select your Cookie Settings or view our Privacy Policy and Terms of Use.
Cookie Settings
Cookies and similar technologies are used on this website for proper function of the website, for tracking performance analytics and for marketing purposes. We and some of our third-party providers may use cookie data for various purposes. Please review the cookie settings below and choose your preference.
Used for the proper function of the website
Used for monitoring website traffic and interactions
Cookie Settings
Cookies and similar technologies are used on this website for proper function of the website, for tracking performance analytics and for marketing purposes. We and some of our third-party providers may use cookie data for various purposes. Please review the cookie settings below and choose your preference.
Strictly Necessary: Used for the proper function of the website
Performance/Analytics: Used for monitoring website traffic and interactions
Long-term exposure to ambient ozone appears to accelerate arterial conditions that progress into cardiovascular disease and stroke, according to a new University at Buffalo study. The study found that chronic exposure to ozone was associated with a progression of thickening of the main artery that supplies blood to the head and neck.
In-cylinder pressure (on the left) and heat release rate (on the right) as a function of the CAD and ozone concentration injected in the intake of the engine for PRF40. The results show that ozone seeding improves combustion and advances phasing. The same trends were observed for the other fuels studied. Credit: ACS, Masurier et al.
have developed a simulator able to predict tropospheric ozone concentrations across the whole of South and East Asia. The project was carried out in collaboration with Tsinghua University in China, The Energy and Resources Institute (TERI) in India, and the International Institute for Applied Systems Analysis (IIASA) in Austria.
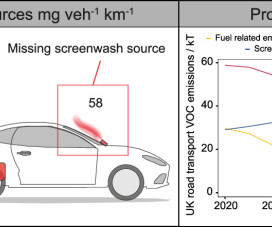
In a recent open-access paper published in ACS’ Environmental Science & Technology , researchers from the University of York report that alcohols in windshield washer fluid account for a larger fraction of real-world vehicle emissions than previous estimates have suggested. —Cliff et al.
The decrease in CO 2 equivalent emissions of ODSs (ozone-depleting substances: CFCs, halons, HCFCs, and others) may be offset by the projected increase in their non-ozone depleting substitutes (HFCs) (lines designated as HFC scenarios). Climate and the Ozone Layer. Source: UNEP. Click to enlarge.
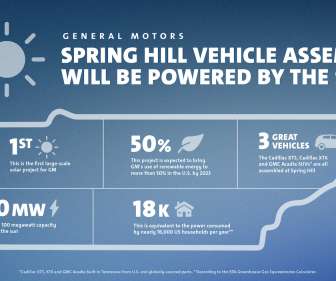
General Motors expects its Spring Hill Manufacturing plant will be powered by 100% solar energy beginning in late 2022. A green tariff agreement with the Tennessee Valley Authority is expected to supply up to 100 megawatts of solar energy per year, or the amount of electricity consumed by 18,000 United States households annually.
Black carbon and tropospheric ozone are harmful air pollutants that also contribute to climate change. Reducing black carbon and tropospheric ozone now will slow the rate of climate change within the first half of this century, the study said. Click to enlarge. °C (within a likely range of 0.2-0.7
million of Fiscal Year 2013 funds ( FTA-2014-001-TRI ) for the deployment of low- or no-emission (LoNo) transit buses. The main purpose of the LoNo Program is to deploy the cleanest and most energy efficient US-made transit buses that have been largely proven in testing and demonstrations but are not yet widely deployed in transit fleets.
Researchers at the University of Colorado, Boulder and the National Renewable Energy Laboratory (NREL) modeled the emissions impact had plug-in hybrid electric vehicles (PHEVs) replaced light duty gasoline vehicles in the Denver, Colorado area in summer 2006. VOC emissions would have been reduced by 57 tpd.
Energy diagram for the combination of nitrogen dioxide and the hydroxyl radical. The two combine in the atmosphere to make either nitric acid or peroxynitrous acid; the so-called branching ratio of these two chemicals is important in models of ozone production. Credit: Caltech/Mitchio Okumura. Click to enlarge.
This research, published in the journal Separation and Purification Technology , shows that ozone can be used to remove not only SO x but also NO x from fossil fuel combustion exhaust streams. In this study, to improve absorption performance of SO 2 and NO 2 , we added ozone in exhaust gas. Osaka et al.
2010 engines emissions reduction relative to 2010, 2007, and 2004 US emission standards. The study, the Phase 2 Report of the comprehensive Advanced Collaborative Emissions Study (ACES). These reductions came while emissions of fine particles were also 92% lower than the 2010 standard 99% lower than 2004 emissions.
A new study by researchers at MIT has found that factoring the non-CO 2 combustion emissions and effects into the lifecycle of a Synthetic Paraffinic Kerosene (SPK) aviation fuel can lead to a decrease in the relative environmental merit of the SPK fuel compared to conventional jet fuel. Aviation climate change impacts pathway.
Researchers at Tohoku University in Japan have identified a way to reduce harmful NO emissions produced by ammonia fuel during combustion. Although the space and time-averaged emission (STAE) of NO was found to decrease with increase in the global equivalence ratio (global ?) Copyright : Taylor & Francis.
Five technology paths for very-low-NO x and GHG emissions from heavy-duty natural gas engines. The “Pathways to Near-Zero-Emission Natural Gas Heavy Duty Vehicles” report, authored by GNA on behalf of Southern California Gas Co. An 80% reduction of GHG emissions is targeted for 2050, relative to 1990 levels. Click to enlarge.
In its recently released Inventory of US Greenhouse Gas Emissions and Sinks: 1990 – 2011 ( earlier post ), the US Environmental Protection Agency (EPA) reported that methane (CH 4 ) emissions from the field production of natural gas have declined by 36% from 2007 to 2011 (from 83.1 CH 4 emissions represented 8.8%
The European Community’s air pollutant emission inventory report released by the European Environment Agency finds that in 2007, sulphur oxides (SO x ) emissions were down by 72 % from 1990 levels. EU-27 emissions of all four pollutants were lower in 2007 than in 2006.
The entire life cycle of the passenger cars is taken into account, including the manufacture of the vehicles and the environmentally relevant emissions from driving. Depletion of fossil energy resources [kg oil-eq.]. Deterioration of the ozone layer [kg CFC-11-eq.]. Noise emissions [Person-Pascal/second]. in review).
The battery systems were investigated with a functional unit based on energy storage, and environmental impacts were analyzed using midpoint indicators. They also found higher life cycle global warming emissions than have been previously reported. A paper on the study appears in the ACS journal Environmental Science & Technology.
million in funding by the New York State Energy and Research Development Authority (NYSERDA) to supply diesel emission control technology as part of a New York City ferry emission reduction program. Over the next several months, CDT will supply and manage the installation of the emission control technology.
FTP cycle-weighted tailpipe emissions of N 2 O, NO x , and the sum of NMOG and NO x. The minimum in NO x and NMOG emissions for midlevel ethanol blends points to future opportunities for emission reductions from FFVs. Credit: ACS, Hubbard et al. Click to enlarge. E40); and the new range for high-level ethanol blends (E55, E80).
Emission standard. Photochemical Ozone Creation Potential (kg Ethene equivalent). Quantifies the production of pollutant ozone (? to ozone layer), the results of the reaction of sunlight on NO x and volatile organic compounds. water, and non-renewable energies (crude oil, coal.) emissions). emissions).
Funded in part by a $5-million zero-emissions grant from the Federal Aviation Administration, the electric buses replace the aging compressed natural gas bus fleet that has been operating at SJC since 2008. The electric bus fleet is anticipated to reduce ozoneemissions by 1.1
Decomposition of the decadal change in total global CO 2 emissions from fossil fuel combustion by four driving factors; population, income (GDP) per capita, energy intensity of GDP and carbon intensity of energy. Total anthropogenic GHG emissions were the highest in human history from 2000 to 2010 and reached 49 (±4.5)
The US, Canada, and Mexico have submitted a proposal to strengthen climate protection under the Montreal Protocol— the international treaty that phases out the production of a number of substances responsible for ozone depletion. The proposal targets the production and use of HFCs, a group of “super” greenhouse gases. Source: IGSD.
For example, states in the western US (WUS) generally produce a larger fraction of their electricity from renewable and/or “emission-free” sources (i.e., Most studies that have examined the impact of EVs report only changes in the total emissions associated with their adoption, but do not consider their spatial or temporal variation.
million to transit projects that improve emissions while supporting emerging clean fuel and advanced propulsion technologies. million from FTA’s Transit Investment in Greenhouse Gas and Energy Reduction (TIGGER) III Program. million from FTA’s Transit Investment in Greenhouse Gas and Energy Reduction (TIGGER) III Program.
Energy Secretary Steven Chu announced up to $10 million is available ( DE-FOA-0000669 ) this year to demonstrate and deploy electric transportation technologies for cargo vehicles, such as trucks, locomotives and forklifts.
Seasonal ethanol emissions from North America. Emissions for present-day are compared to those for the EISA and All-E85 scenarios. However, the significance of this effect will depend on the size of the emission change compared to that of the existing source fluxes, which are poorly known. Labels at left are months (e.g.,
The California Energy Commission unanimously adopted the 2013-2014 Investment Plan Update to support the development and use of green vehicles and alternative fuels. They are available only for new natural gas and propane vehicles that meet all the emission requirements of the California Air Resources Board.
positive or negative—and magnitude of net climate forcing from BC emissions), currently available scientific and technical information provides a strong foundation for making mitigation decisions to achieve lasting benefits for public health, the environment, and climate. emissions in 2005. Earlier post.). Earlier post.).
Contributions of regions to total life cycle emissions for three fuels (µg per vehicle-mile traveled per km 2 land area). Dashed lines show US average emissions. On-road transportation accounts for approximately 20% of United States energy consumption. Associated tailpipe emissions alone account for 40?60%
Of our "alternative fuel" options, only electricity can truly be made renewably (wind, solar, geothermal, small hydro), with no carbon or other noxious emissions. And only electric drive cars can operate truly zero-emission. We need to prioritize clean electricity generation and plug-in battery cars to utilize that energy efficiently.
Source: “Hidden Costs of Energy”. Because these effects are not reflected in energy prices, government, businesses and consumers may not realize the full impact of their choices. GHG emissions (grams CO 2 -eq)/VMT by life-cycle component for different combinations of fuels and light-duty automobiles in 2005 (top) and 2030 (bottom).
Respectively, Title IV of the 1990 Clean Air Act and the Ozone Transport Commission/NO x Budget Program.). Policymakers rarely see with perfect foresight what the appropriate emissions targets are to protect the public health and environment—the history is that these targets usually need to get stricter.
From 2005 through 2020, total US greenhouse gas (GHG) emissions are projected to rise by 4% under a “with measures” scenario (but without a cap-and-trade program and other complementary policies), from 7,109 Tg CO 2 Eq. The report projects that transportation-related CO 2 emissions will drop 1.5% to 7,416 Tg CO 2 Eq., 5,813 Tg CO 2 Eq.
More than 2,800 retail sites will offer E15 by 2021, generating approximately 350 million new ethanol gallons annually, according to a one-pager released by biofuel trade association Growth Energy. The higher the RVP of a fuel, the worse its emissions are. —Growth Energy CEO Emily Skor.
Emission rates for the 1.7 A new study led by researchers at the University of Michigan compared regulated and unregulated emissions from both light-duty passenger car (1.7 Their paper appears in the ACS journal Energy & Fuels. Unregulated pollutants also include ozone precursors and bioaccumulative and toxic compounds.
eutrophication; ET = ecological toxicity; FEC = fossil energy consumption; WU = water use; LO = land occupation; “The rest” includes acidification; smog formation; ozone layer depletion; and human health effects. Error bar shows regional variations for E85. GW = global warming; Eut. Credit: ACS, Yang et al. Click to enlarge.
Consumer products such as shampoo, cleaning products and paint now contribute as much to emitted volatile organic compounds (VOCs) in cities as tailpipe emissions from vehicles, according to a new study led by NOAA. Total VOC emission factors for end uses of petrochemical sources in the study. McDonald et al. Click to enlarge.
El-Hannouny’s research is funded by two different DOE offices in the Office of Energy Efficiency and Renewable Energy (EERE). The first is the Vehicle Technologies Office (VTO), which aims to advance combustion engine technology and simultaneously reduce criteria emissions, such as carbon monoxide, nitrogen oxides and ozone.
According to a new study led by a team at Duke University, airborne particulate matter and dust are cutting solar photovoltaic energy output by more than 25% in certain parts of the world, with roughly equal contributions from ambient PM and PM deposited on photovoltaic surfaces. —Michael Bergin.
Energy consumption and GHG emissions per PKT (passenger kilometer travelled). Inventorying criteria air pollutants showed that vehicle non-operational components often dominate total emissions. Life-cycle criteria air pollutant emissions are between 1.1 The vehicle operation components are shown with gray patterns.
Among the non-CO 2 pollutants are hydrofluorocarbons (HFCs), methane, tropospheric ozone, and black carbon soot. Ramanathan and Victor highlight the importance of aggressively reducing CO 2 emissions, but note that the road ahead will be long, difficult, and expensive, and that “in the meantime, a fast-action plan is needed.”
We organize all of the trending information in your field so you don't have to. Join 5,000+ users and stay up to date on the latest articles your peers are reading.
You know about us, now we want to get to know you!
Let's personalize your content
Let's get even more personalized
We recognize your account from another site in our network, please click 'Send Email' below to continue with verifying your account and setting a password.


Let's personalize your content