This site uses cookies to improve your experience. To help us insure we adhere to various privacy regulations, please select your country/region of residence. If you do not select a country, we will assume you are from the United States. Select your Cookie Settings or view our Privacy Policy and Terms of Use.
Cookie Settings
Cookies and similar technologies are used on this website for proper function of the website, for tracking performance analytics and for marketing purposes. We and some of our third-party providers may use cookie data for various purposes. Please review the cookie settings below and choose your preference.
Used for the proper function of the website
Used for monitoring website traffic and interactions
Cookie Settings
Cookies and similar technologies are used on this website for proper function of the website, for tracking performance analytics and for marketing purposes. We and some of our third-party providers may use cookie data for various purposes. Please review the cookie settings below and choose your preference.
Strictly Necessary: Used for the proper function of the website
Performance/Analytics: Used for monitoring website traffic and interactions
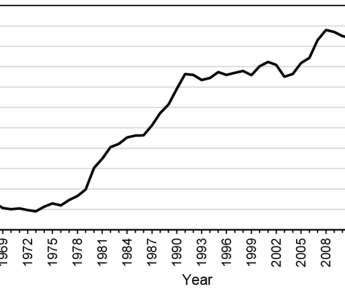
vehicle fueleconomy. Specifically, this study examines actual fueleconomy of cars and light trucks (pickup trucks, SUVs, and vans) from 1966 through 2019. (My Calculated vehicle fueleconomy is available going back to 1923. Annual statistics from the U.S. Department of Transportation. 8 years.
vehicle fueleconomy. Specifically, this study examines actual fueleconomy of cars and light trucks (pickup trucks, SUVs, and vans) from 1966 through 2017. Calculated vehicle fueleconomy is available going back to 1923. Annual statistics from the U.S. Department of Transportation.
Laboratory and in-use fueleconomy results Source: NREL. The NREL team collected and analyzed in-service fueleconomy, maintenance, and other vehicle performance data on 11 hybrid (P100H) and 11 conventional diesel (P100D) step vans operated by the United Parcel Service (UPS) in Minneapolis. Click to enlarge.
The gap between official and real-world fuel-economy figures in Europe has risen to about 38%, according to a new report published by the International Council on Clean Transportation (ICCT). However, by aggregating large sets of on-road fuel consumption data, clear trends can be observed. Source: ICCT. Click to enlarge.
UPS van fueleconomy comparison. UPS’ first-generation diesel hybrid delivery vans improved the on-road fueleconomy by 28.9% The 12-month average fueleconomy for the P70 hybrid vans is 13.1 The 12-month average fueleconomy for the P70 hybrid vans is 13.1 Source: Lammert 2009.
On a drive cycle representing routes with frequent stops and accelerations, the gHEV trucks exhibited a 20% improvement in fueleconomy. On drive cycles representing routes with fewer stops and accelerations, the gHEV trucks demonstrated similar fueleconomy to the diesels. gasoline engine and Azure Dynamics, Inc.
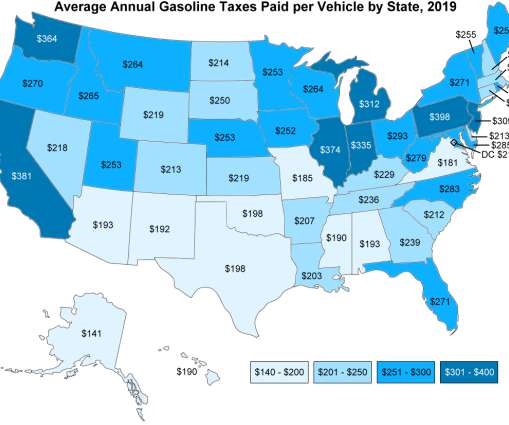
According to the Federal Highway Administration, the average fueleconomy for all light vehicles on the road today is 22.3 Based on a vehicle with an average fueleconomy of 22.3 Department of Transportation, Federal Highway Administration, Highway Statistics 2017, Table VM-1; and tax data by state from the U.S.
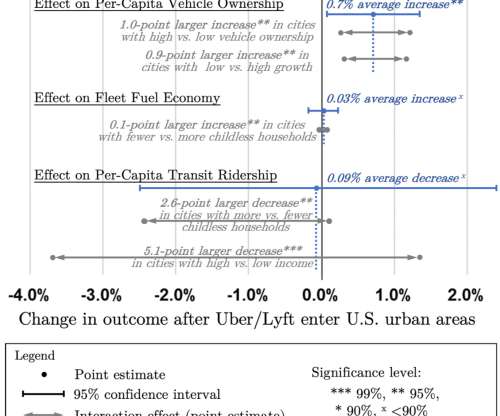
The study found no statistically significant average effect of TNC entry on fueleconomy or transit use but did find evidence of heterogeneity in these effects across urban areas, including larger transit ridership reductions after TNC entry in areas with higher income and more childless households. Ward et al. 2020.101933.
Also, the list of standard test procedures addressed in SAE J1711 has been expanded to cover all five major test cycle procedures (UDDS, HFEDS, US06, SC03, and Cold FTP) now being used to evaluate vehicle fueleconomy. There are two basic exhaust emissions and fueleconomy tests described in J1711. Earlier post.)
The test fleet showed statistically significant effects for some pollutants, but not for others. NO x emissions, a target pollutant of concern for this program, did not show any statistically significant difference between the fuels for the FTP nor for each individual FTP phase.
The slowing of vehicle turnover has implications for transportation fuel consumption, because newer vehicles tend to have better fueleconomies. Data from the Bureau of Labor Statistics’ Consumer Expenditures Survey show that spending on vehicle repair and maintenance has also increased in recent years.
Gasoline consumption per capita was calculated using the population estimates in the ProQuest Statistical Abstract of the United States. Not coincidentally, the first Corporate Average FuelEconomy (CAFE) standards for new cars and light trucks became effective with 1978 model-year vehicles. Consumption per capita.
A new analysis from the Consumer Federation of America (CFA) of consumer polling data finds that the proposed MY 2017-2025 passenger vehicle fueleconomy (CAFE) and greenhouse gas (GHG) emissions standards to be finalized this summer ( earlier post ) align with consumer demands and needs. mpg US (5.87 L/100km) in model year 2025.
The gap between official fuel-economy figures and the real world for new cars in the EU has reached 40 per cent, according to the latest update by the International Council on Clean Transportation (ICCT) to its on-going research into in-use vehicle fuel efficiency and CO 2 emissions. Earlier post.).
Gasoline direct-injection (GDI) engines have higher fueleconomy compared to the more widely used port fuel injection (PFI) engines. Among the findings from the study: For vehicles certified to the same emissions standard, there is no statistical difference of regulated gas-phase pollutant emissions between PFIs and GDIs.
The morning session started out with an hour long press conference, the highlight being the unveiling of the Volt’s 230 mpg preliminary EPA city fueleconomy finding ( earlier post ), as well as a tour showing selected elements from the studios of the four GM North American brands: Chevrolet, GMC, Buick and Cadillac. Click to enlarge.
The researchers used four fuels: a baseline US EPA Tier 3 E10 fuel; one E10 fuel with higher aromatics content than the baseline E10; an E30 fuel that was splash-blended with the Tier 3 E10; and an E78 fuel. Testing was conducted over triplicate cold-start and hot-start LA92 cycles.
World energy growth over the next twenty years is expected to be dominated by emerging economies such as China, India, Russia and Brazil while improvements in energy efficiency measures are set to accelerate, according to BP’s latest projection of energy trends, the BP Energy Outlook 2030. Click to enlarge. Coal will increase by 1.2%
Statistics are curious and often contradictory things. That's doubly so when they reveal shopping habits, because shoppers are curious and contradictory creatures.
in May, while diesel fuel declined 7%, according to the latest figures from the California Board of Equalization (BOE). California gasoline consumption rose 0.6% We’re in an uncertain time. Yee, Chairwoman of the BOE. May 2009 gasoline sold for use on California roads totaled 1,291 million gallons of gasoline.
Fuel Efficiency Improvement Technologies for Conventional Stoichiometric Gasoline Direct Injection Multi-Cylinder Internal Combustion Engine. All fuel consumption testing must be conducted according to automotive industry norms.
The authors conducted statistical analysis on the effects of temperature and constructed an electric vehicle charging model that can show the dynamics of DCFC charging process under different temperatures. Decreased fueleconomy in cold weather is also a well-known phenomenon with gasoline and diesel-powered vehicles.
The 2012 version of the Chevrolet Sonic (known in some markets at the Chevrolet Aveo) will boast fueleconomy of 40mpg on the highway and 29mpg in the city, resulting in a combined fueleconomy total of 33mpg. Its statistics will make it one of the most fuel efficient small cars in the North American [.].
When we say we met the hurdle, part of that is through improved fueleconomy with actual equipment, and part of it is how we eliminate empty miles—excess miles. One of the key statistics: year to date, we have shipped 150 million more cases and yet driven 90 million less miles. How we load the trailer, the effects of packaging.
Now the manufacturer is targeting improved fueleconomy with each model change too. According to its statistics, the savings achieved by all currently available models compared to their predecessors lie in the double digit percentage range even though they offer increased performance [.].
Standards under development in these areas include: J1711: Emissions and FuelEconomy Testing. Such procedures will be used during exhaust emissions tests and fueleconomy certification tests, and may be used for future “charge economy” certification tests.
Data was provided by Manheim Auctions, Vincentric, Black Book, Environmental Protection Agency, National Highway Traffic Safety Administration, Bureau of Labor Statistics, Energy Information Administration and Federal Highway Administration. —Bruce Belzowski.
Reducing the environmental impact of freight transportation in the face of increasing trade and economic growth in North America requires much more than continued progress on fueleconomy and transport technology. It is estimated that the North American economy will grow by 70–130% between the years 2005 and 2030.
All failures are tracked and statistically evaluated. Reliability of the fuel cell system has grown steadily during fleet operation, Mercedes-Benz says. To further improve the reliability of the fuel cell system, new components will be required. In some cases, fuel consumption was less than 1 kg/100 km. Fleet results.
You might be forgiven for thinking that as cars get ever heavier, better equipped, safer, more practical, more powerful and faster, fueleconomy would suffer. Thankfully, the EPA''s latest set of statistics proves that isn''t the case--and dispels other notions such as increasing weight and ever greater power figures, too.
You might think that in more environmentally conscious times, fueleconomy figures would keep on improving. However, new statistics from Truecar.com show thatUSfuel economy has actually dropped back to 21.6mpg in June, compared to 21.9mpg in May.
Current understanding and modeling capability of stochastic processes in engines remains limited and prevents designers from achieving significantly higher fueleconomy, the workshop found. Achievable advances in engine technology can improve the fueleconomy of automobiles by over 50% and trucks by over 30%.
The technology developed under this subtopic must be capable of separating or reforming convention fuels and be packaged on conventional light or heavy duty vehicles without disrupting the existing system. All fuel consumption testing must be conducted according to engine industry norms. are desired.
Empirical results also revealed that even if the fueleconomy of less fuel-efficient ordinary passenger vehicles were improved to levels comparable with those of the best available technology, i.e. hybrid passenger cars currently being produced in Japan, total CO 2 emissions would decrease by only 0.2%.
However, increased dilution leads to increased combustion instability resulting in reduced fuel-economy benefits. In the past, researchers had to rely on highly simplified engine models to simulate the thousands of consecutive engine cycles needed to study the cycle-to-cycle variability with statistical accuracy.
They simply don’t come much more frugal than the SEAT Ibiza Ecomotive, which recently clocked up an impressive average fueleconomy of more than 120mpg as part of a mammoth 1,186mile tour of 12 European countries. He set out from Cieszyn in Poland after the International Police Motor Corporation sealed the car’s bonnet and fuel filler.
The previous government in New Zealand may have proposed a fueleconomy standard, but now the new government has announced it will not proceed with those plans. Tags: Green cars Latest news fueleconomyfueleconomy standard New Zealand. km to 203.8g/km km in the first half of this year.
This longevity is evidenced by a B10 life of 7,000 hours (the service life for a statistical expectation of 10% attrition) or 250,000 km in a vehicle application. Low cost of ownership was of paramount importance to the design team, and the new engine boasts excellent longevity and ease of service.
Higher fueleconomy of CAVs will cause the per-mile fuel cost of travel to drop. This, in turn, will induce additional travel that partially offsets the fuel savings of energy efficiency—commonly referred to as a “rebound effect”. Traditionally, time spent driving has been viewed as a cost to the driver.
However, a closer look at its statistics reveals that this is a vehicle that places a strong emphasis on going green too. The new Volkswagen Golf R (pictured) is grabbing headlines as one of the fastest and most powerful Golf models to date. With a new 296hp TSI engine, the vehicle is rightly garne[.]. Latest News Green cars Volkswagen'
is its remarkable fueleconomystatistics. When the new Bentley Continental GT Speed Convertible (pictured) makes its debut at the North American International Auto Show later this month, you might expect the focus to be on its slick looks, its power or its speed. The new [.].
Among their findings: Ambient pollutants (NO x , PM 2.5 , CO) and meteorological variables (wind speed, temperature, relative humidity, dew point) explained 5–44% of outdoor pollutant variability, while the time spent traveling behind a bus was statistically significant for PM 2.5 , lung-deposited surface area (SA), and CO.
However, taking into account inter-trip charging information can significantly improve the fueleconomy of PHEVs. To address these limitations, we herein propose a generic framework of on-line EMS for PHEVs that uses an evolutionary algorithm (EA) to optimize vehicle fueleconomy in real time.
Volkswagen, seeing the hybrid as complementary to the Jetta TDI diesel in attracting different, yet equally fuel-economy-conscious buyers, is initially targeting 5% of Jetta sales in the US for the new hybrid model. kWh Li-ion battery pack. The company anticipates EPA-rated combined mileage of around 45 mpg US (5.2 l/100 km).
We organize all of the trending information in your field so you don't have to. Join 5,000+ users and stay up to date on the latest articles your peers are reading.
You know about us, now we want to get to know you!
Let's personalize your content
Let's get even more personalized
We recognize your account from another site in our network, please click 'Send Email' below to continue with verifying your account and setting a password.


Let's personalize your content