This site uses cookies to improve your experience. To help us insure we adhere to various privacy regulations, please select your country/region of residence. If you do not select a country, we will assume you are from the United States. Select your Cookie Settings or view our Privacy Policy and Terms of Use.
Cookie Settings
Cookies and similar technologies are used on this website for proper function of the website, for tracking performance analytics and for marketing purposes. We and some of our third-party providers may use cookie data for various purposes. Please review the cookie settings below and choose your preference.
Used for the proper function of the website
Used for monitoring website traffic and interactions
Cookie Settings
Cookies and similar technologies are used on this website for proper function of the website, for tracking performance analytics and for marketing purposes. We and some of our third-party providers may use cookie data for various purposes. Please review the cookie settings below and choose your preference.
Strictly Necessary: Used for the proper function of the website
Performance/Analytics: Used for monitoring website traffic and interactions
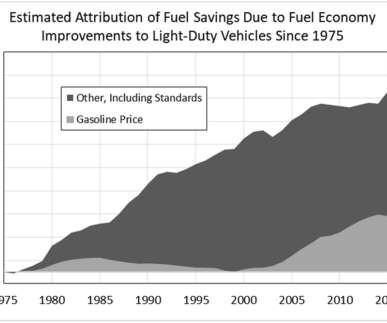
A team from the University of Tennessee and the National Renewable Energy Laboratory (NREL) has the fuel savings due to fuel economy improvements over the past 43 years amount to approximately two trillion gallons of gasoline. Their paper is published in the journal Energy Policy. Greene et al. has almost doubled.
The collapse in world oilprices in the second half of 2014 will have only a moderate impact on the fast-developing low-carbon transition in the world electricity system, according to research firm Bloomberg New Energy Finance. However, the slump in the Brent crude price per barrel from $112.36 on 30 June to $61.60
In both the base-case and a scenario with more aggressive environmental policies, CO 2 emissions from energy use remain well above the IEA 450 scenario. Non-OECD countries are seen to rapidly increase their share of overall energy demand from just over half currently to two-thirds. Click to enlarge. per year.
The US Energy Information Administration (EIA) expects global consumption of liquid fuels such as gasoline, diesel, and jet fuel, to set new record highs in 2024. Areas of uncertainty include Russian oil supply and OPEC production. EIA forecasts US gasoline prices to average around $3.30 per gallon in 2023 and $3.10
As oilprices remain unsteady and OPEC continues to make headlines every hour, the world is focused on oil’s immediate future. With this kind of impending discrepancy between supply and demand, the industry needs to start looking for new sources of oil, and quickly. by Haley Zaremba for Oilprice.com.
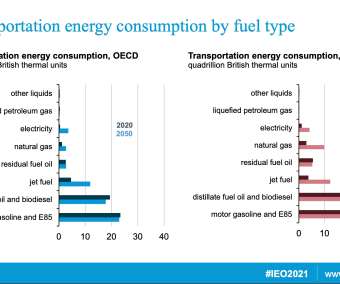
The US Energy Information Administration (EIA) projects that, absent significant changes in policy or technology, world energy consumption will grow by nearly 50% between 2020 and 2050. Liquid fuels remain the largest source of energy consumption, driven largely by the industrial and transportation sectors.
The demand for oil in 2015 will drop to its lowest level since 2002 because of an oversupply of crude and stagnant economies in China and Europe, according to OPEC’s latest forecast. OPEC’s monthly report said demand for the cartel’s oil will fall to 28.9 OPEC’s monthly report said demand for the cartel’s oil will fall to 28.9
Global energy intensity, 1981-2010. Global energy intensity—defined as total energy consumption divided by gross world product—increased 1.35% in 2010, the second year of increases in the context of a broader trend of decline over the last 30 years, according to a new Vital Signs Online article from the Worldwatch Institute.
World petroleum and other liquid fuels consumption will increase 38% by 2040, spurred by increased demand in the developing Asia and Middle East, according to the Reference Case projections in International Energy Outlook 2014 ( IEO2014 ), released by the US Energy Information Administration (EIA).
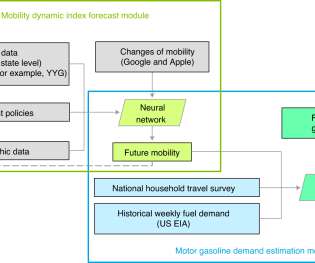
Their open-access paper appears in the journal Nature Energy. Therefore, beyond the immediate economic responses, the longer-term impact on the US economy may persist well beyond 2020. However, few studies have quantified and forecast the oil demands under multiple pandemic scenarios, and this research is desperately needed.
Predicting and diagnosing the trajectory of oilprices has become something of a cottage industry in the past year. But along with all of the excess crude flowing from the oil patch, there is also an abundance of market indicators that while important, tend to produce a lot of noise that makes any accurate estimate nearly impossible.
Energy consumption by light-duty vehicles in the United States, AEO2013 and AEO2014, 1995-2040 (quadrillion Btu). LDV energy consumption declines in AEO2014 Reference case from 16.0 Delivered energy demand for heavy-duty vehicles (HDVs) in AEO2014 increases from 5.3 HDV energy demand is tempered somewhat by an average 0.5%
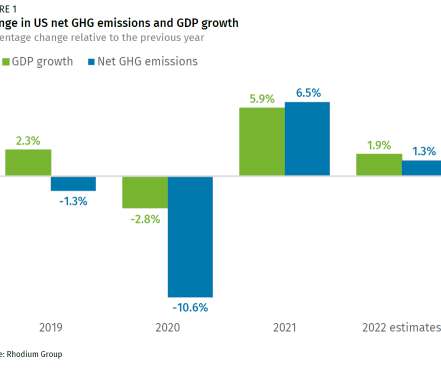
The year 2022 was marked by the emergence of longer-term economic repercussions of the COVID-19 pandemic and an unexpected war in Eastern Europe that caused turmoil in energy markets. Consequently, the US economy grew 1.9% Consequently, the US economy grew 1.9% in 2022, down from a 5.7% GDP increase in 2021.
Energy demand growth moves to Asia. The newly released 2013 edition of the IEA World Energy Outlook (WEO) depicts a world in which some long-held tenets of the energy sector are being rewritten; importers are becoming exporters, while exporters are among the major sources of growing demand. Source: IEA. Click to enlarge.
The AFDC’s new Petroleum Reduction Planning Tool is an interactive Web application that allows fleet managers to evaluate the benefits associated with five alternative fuels—biodiesel, electricity, ethanol, natural gas and propane—along with a variety of efficiency measures, such as idle reduction and fuel economy improvements.
Worldwide energy consumption will grow by 53% between 2008 and 2035 with much of the increase driven by strong economic growth in the developing nations, especially China and India, according to the reference case in the newly released International Energy Outlook 2011 (IEO2011) from the US Energy Information Administration (EIA).
The question begs then, has that money shown up in other parts of the economy? Columbia and Associate Director of the Maguire Energy Institute at the Cox School of Business at Southern Methodist University in Dallas says it has: “No question we’re seeing the effects of lower oilprices throughout the economy.”.
If West Texas Intermediate (WTI) crude oilprices stabilize at or above $60 per barrel, major parts of the United States shale sector that are currently dormant will ramp up, according to an analysis by experts in the Center for Energy Studies at Rice University’s Baker Institute for Public Policy. Baker III and Susan G.
The world’s consumption of gasoline, diesel fuel, jet fuel, heating oil, and other petroleum products reached a record high of 88.9 The rapidly industrializing economies of China and India fueled much of Asia’s demand increase, growing 2.8 Year-on-year changes in petroleum consumption by region. Source: EIA. Click to enlarge.
The Annual Energy Outlook 2015 (AEO2015) released today by the US Energy Information Administration (EIA) projects that US energy imports and exports will come into balance—a first since the 1950s—because of continued oil and natural gas production growth and slow growth in energy demand.
World primary energy consumption grew by 2.5% Oil remains the world’s leading fuel, but its 33.1% Global energy consumption grew by 2.5% seen in 2010, according to the newly released BP Statistical Review of World Energy, 2012. Global energy consumption grew by 2.5% in the emerging economies. Source: BP.
The US Energy Information Administration released its Annual Energy Outlook 2013 (AEO2013) Reference case (the Early Release ), which highlights a growth in total US energy production that exceeds growth in total US energy consumption through 2040. Click to enlarge. Increased sales for hybrids and PHEVs.
The global energy map is changing significantly, according to the 2012 edition of the Internal Energy Agency’s (IEA) World Energy Outlook ( WEO-2012 ). The IEA said these changes will recast expectations about the role of different countries, regions and fuels in the global energy system over the coming decades.
Change in primary oil demand by sector and region in the central New Policies Scenario, 2010-2035. At a high level, the report notes that there are few signs that the urgently needed change in direction in global energy trends is underway. Click to enlarge. The passenger vehicle fleet doubles to almost 1.7 billion in 2035.
The Nikkei reports that the nationwide average price in Japan for regular gasoline was ¥139.8 per gallon US) as of Monday, dropping for the 13 th straight week to a 16-month low, according to the Agency for Natural Resources and Energy. per liter ($6.65
Profound shifts in the regional distribution of oil demand and supply growth will redefine the refining industry and transform global oil trade over the next five years, according to the annual Medium-Term Oil Market Report (MTOMR) released by the International Energy Agency (IEA). The oil market is at a crossroads.
World marketed energy consumption is projected to grow by 44% between 2006 and 2030, driven by strong long-term economic growth in the developing nations of the world, according to the reference case projection from the International Energy Outlook 2009 ( IEO2009 ) released today by the US Energy Information Administration (EIA).
The Annual Energy Outlook 2011 (AEO2011) Reference case released yesterday by the US Energy Information Administration (EIA) more than doubles the technically recoverable US shale gas resources assumed in AEO2010 and added new shale oil resources. Delivered energy consumption in the transportation sector grows from 27.2
The average US household will spend about $550 less on gasoline in 2015 compared with 2014, as annual motor fuel expenditures are on track to fall to their lowest level in 11 years, according to projections by the US Energy Information Administration (EIA). The price for US regular gasoline has fallen 11 weeks in a row to an average $2.55
The True Cause of Recessions: OIL. Recently I had the opportunity to speak at the annual Pennsylvania Energy Festival ( [link] ) back in September of this year. I was asked to speak about the economic impact of our oil dependency and so I began researching this topic to see if I could draw some insightful conclusions.
A new study by the Peterson Institute for International Economics concluded that the Kerry-Lieberman “American Power Act”—the energy and climate change legislation recently introduced in the Senate ( earlier post )—would reduced US oil imports by 33-40% below current levels and by 9-19% below projected business-as-usual levels by 2030.
Energy efficiency has tremendous potential to boost economic growth and avoid greenhouse gas emissions, but the global rate of progress is slowing, according to a new report by the International Energy Agency. Global primary energy demand rose by 2.3% In 2018, higher oilprices helped dampen demand for road transport fuels.
Energy-related CO 2 emissions declined by 2.8% in 2008 to 5,802 million metric tons of carbon dioxide (MMTCO 2 ), down from 5,967 MMTCO 2 in 2007, according to preliminary estimates released by the Energy Information Administration (EIA). Total US energy-related carbon dioxide emissions have grown by 15.9% Source: EIA.
Technically feasible levels of energy efficiency and decarbonized energy supply alone will not be sufficient to reduce greenhouse gas emissions 80% below 1990 levels by 2050, according to a detailed modeling of the California economy performed by a team from Energy and Environmental Economics, the Monterey. 875 Mt CO 2 e.
energy sector will spur a flurry of M&A and investment activity in 2011 as renewable energy. Sustainable Industries Predictions for 2011 include: Cap and Trade Discarded by Congress in National Energy Policy. A national energy policy is a top priority that crosses party lines given its importance to. extraction.
Compared to the reference case, in which gasoline vehicles (ICEVs) remain dominant through 2050 (BAU), OPT results in 16% and 36% reductions in LDV greenhouse gas (GHG) emissions for 2030 and 2050, respectively, corresponding to 5% and 9% reductions in economy-wide emissions. Credit: ACS, Keshavarzmohammadian et al. Click to enlarge.
Oil is a strategic commodity second to none—it underlies the global economy and even the American way of life. Of course, other countries benefit from this fact, with about $900 million flowing out of the US to buy foreign oil every day, and about 40% of that going to OPEC. [ Source: EIA. Click to enlarge.
In the paper, the researchers link econometric models of the production profitability of 1,933 global oilfields (representing about 90% of the world’s supply in 2015) with their production carbon intensity, a measure of the amount of carbon emitted per unit of energy (or barrel of oil) produced.
I believe we are on the cusp of the next great tectonic shift in our economy, one that will transform the way we use energy both in our homes and on the road. Electrification Coalition member David Crane, President and CEO of NRG Energy. Global Demand for Oil. Resilience to Future Price Shocks.
Weak economic conditions, a mild winter, and energy. savings stimulated by high oilprices led to a decrease of 3% in CO 2 emissions in the European Union and of 2% in both the United States and Japan. tonnes per capita, despite a decline due to the recession in 2008-2009, high oilprices and an increased share of natural gas.
The MIT Energy Initiative (MITEI) has released a report on the proceedings—and papers that informed those proceedings—of the 8 April 2010 symposium on The Electrification of the Transportation System: Issues and Opportunities. The symposium was sponsored by the MIT Energy Initiative, together with Ormat, Hess, Cummins and Entergy.
Although electric vehicles (EVs) are making headlines, they are not yet a market force to replace the internal combustion engines that power today’s automotive fleets, so oil demand is currently growing strong. percent of the global vehicle fleet; so their influence on the oil market, in the short term, is limited.
The US Energy Information Administration (EIA) released its Reference case projections for US energy markets through 2035. It also assumed implementation of existing regulations that enable the building of new energy infrastructure and resource extraction. Total US primary energy consumption , which was 101.4
In 2008, a report by UNEP called for the elimination of fossil-fuel subsidies, concluding that such subsidies often lead to increased levels of consumption and waste; place a heavy burden on government finances; can undermine private and public investment in the energy sector; and do not always end up helping the people who need them most.
We organize all of the trending information in your field so you don't have to. Join 5,000+ users and stay up to date on the latest articles your peers are reading.
You know about us, now we want to get to know you!
Let's personalize your content
Let's get even more personalized
We recognize your account from another site in our network, please click 'Send Email' below to continue with verifying your account and setting a password.


Let's personalize your content