This site uses cookies to improve your experience. To help us insure we adhere to various privacy regulations, please select your country/region of residence. If you do not select a country, we will assume you are from the United States. Select your Cookie Settings or view our Privacy Policy and Terms of Use.
Cookie Settings
Cookies and similar technologies are used on this website for proper function of the website, for tracking performance analytics and for marketing purposes. We and some of our third-party providers may use cookie data for various purposes. Please review the cookie settings below and choose your preference.
Used for the proper function of the website
Used for monitoring website traffic and interactions
Cookie Settings
Cookies and similar technologies are used on this website for proper function of the website, for tracking performance analytics and for marketing purposes. We and some of our third-party providers may use cookie data for various purposes. Please review the cookie settings below and choose your preference.
Strictly Necessary: Used for the proper function of the website
Performance/Analytics: Used for monitoring website traffic and interactions
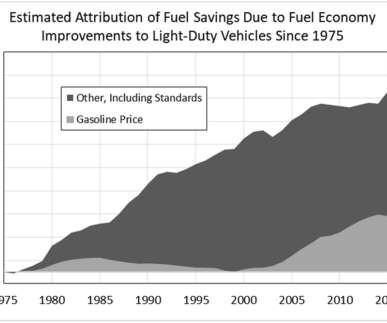
A team from the University of Tennessee and the National Renewable Energy Laboratory (NREL) has the fuel savings due to fuel economy improvements over the past 43 years amount to approximately two trillion gallons of gasoline. Estimated attribution of fuel savings due to fuel economy improvements to light-duty vehicles since 1975.
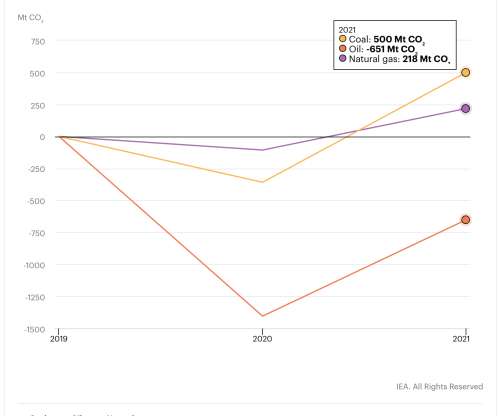
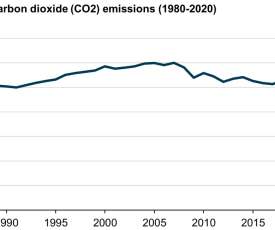
Global energy-related carbon dioxide emissions rose by 6% in 2021 to 36.3 billion tonnes, their highest ever level, as the world economy rebounded strongly from the COVID-19 crisis and relied heavily on coal to power that growth, according to new IEA analysis. In 2021 alone, China’s CO 2 emissions rose above 11.9 billion tonnes.
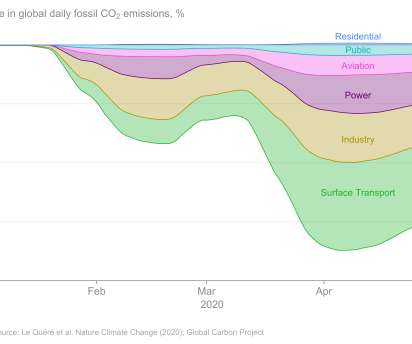
A preliminary analysis of global data has found that carbon dioxide emissions from fossil fuel sources reached a maximum daily decline of 17% in April as a result of drastic decline in energy demand that have occurred during the COVID-19 pandemic. Percentage change in global daily fossil CO 2 emissions, Jan-May 2020. megatonnes (5.9
Increased economic activity and a changing fuel mix in the electric power sector in 2021 will lead to a significant increase in energy-related carbon dioxide emissions this year, according to the US Energy Information Administration’s (EIA) August Short-Term Energy Outlook (STEO). billion metric tons this year.
With alternative fuel vehicles now approaching 1% of new vehicle production, however, they are in fact beginning to have a “ measurable and meaningful impact ” on overall new vehicle fuel economy and CO 2 emissions. In the analysis, EPA uses overall fuel economy in mpg equivalent (mpge) and tailpipe CO 2 emission values.
Vehicle efficiency improvements via effective standards and policies could reduce annual CO 2 e emissions from the US, China, and the EU by 1.3 The US, China, and the EU could reduce their combined annual CO 2 emissions by 1.3 Similar policies can trigger comparable innovations to reduce greenhouse gas emissions, they suggest.
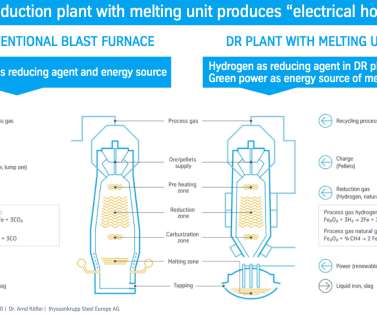
million metric tons, will avoid the emission of 3.5 In addition, we are fulfilling our social responsibility and will already be reducing the CO 2 emissions of our production by just under 20 percent in the first step. That is already five percent of the Ruhr region’s greenhouse gas emissions. The plant, with a capacity of 2.5
Adjusted CO 2 emissions and adjusted fuel economy, MY 1975-2011. The report finds that CO 2 emissions rates and fuel economy values reflect a very favorable multi-year trend beginning in MY 2005. The fleet-wide average real world MY 2011 personal vehicle CO 2 emissions value is 398 g/mi and average fuel economy is 22.4
Vehicle fuel economy improvements have slowed globally, according to the latest report from the Global Fuel Economy Initiative (GFEI): Fuel Economy In Major Car Markets: Technology And Policy Drivers 2005-2017. Overall, global fuel economy has improved by an average of 1.7% in the past two years. L ge /100 km.
Flows for the Zero Emission Fund. launched the Nissan Zero Emission Fund, a new fund for individual Nissan electric vehicle (EV) owners in Japan which converts the amount of CO 2 emissions that are offset by driving the 100% electric Nissan LEAF to generate credits. Click to enlarge. Nissan Motor Co.,
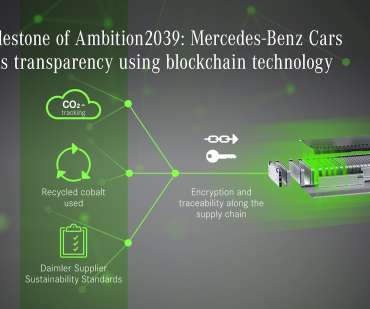
Together with start-up Circulor , Mercedes-Benz is conducting a pilot project for transparency on CO 2 emissions in the cobalt supply chain as part of STARTUP AUTOBAHN. That is why in a first step, Mercedes-Benz is creating transparency of CO 2 emissions and the use of secondary material in the supply chain.
CO 2 per capita emissions from fossil fuel use and cement production from the top 5 emitting regions. Global emissions of CO 2 increased by 3% last year, according to the annual report “Trends in global CO 2 emissions”, released by the EC Joint Research Centre (JRC) and the Netherlands Environmental Assessment Agency (PBL).
The majority of the emissions and fuel savings from current vehicles, EPA noted, is due to new gasoline vehicle technologies. The final model year (MY) 2012 adjusted, real world CO 2 emissions rate is 376 g/mi—a 22 g/mi decrease (-5.5%) relative to MY 2011. MY 2012 adjusted fuel economy is 23.6 Click to enlarge.
A new brief published by the International Transport Forum (ITF)—an intergovernmental organization at the OECD with 59 member countries— identifies proven measures that decrease road freight’s CO 2 emissions. This will offset any expected efficiency gains and lead to an increase in emissions by 2050, not a reduction.
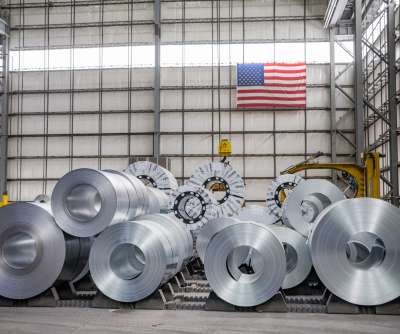
Steel is one of the main sources of CO 2 emissions in our supply chain. Around 20% of supply chain CO 2 emissions for a mid-sized fully-electric vehicle are attributable to steel— which comes in third, after battery cells and aluminum. This steel is then sent back to the BMW Group plants. Earlier post.).
A new analysis of the real-world usage of more than 100,000 plug-in hybrid electric vehicles shows a large deviation between on-road CO 2 emissions and fuel efficiency and the official vehicle type-approval values. Patrick Plötz, Coordinator of the Business Unit Energy Economy at Fraunhofer ISI and lead author of the study.
Global energy-related carbon dioxide emissions were flat for a third straight year in 2016 even as the global economy grew, according to the International Energy Agency. The data signal a continuing decoupling of emissions and economic activity. Global emissions from the energy sector stood at 32.1
The new Sanata improves fuel economy and CO 2 emissions by up to 28% compared to the previous model. First introduced in China in the 1980s, the first generation sold nearly 4 million units, and is one of the most successful models in China.
emissions from fossil fuel use and cement production per region. After a decline in global CO 2 emissions in 2009 of 1% (including a. correction for the leap year 2008), global emissions have. After a decline in global CO 2 emissions in 2009 of 1% (including a. correction for the leap year 2008), global emissions have.
liter i-DTEC engine in the new Civic will deliver CO 2 emissions of 95 g/km, according to Honda Motor Europe’s President, Manabu Nishimae, in his presentation at the Geneva Motor Show. This is a 15-gram drop (13.6%) from the 110 g/km emissions of the enhanced 2.2L Click to enlarge. Honda’s new 1.6-liter Earlier post.).
Diesel fuel economy has been on the minds of long-haul trucking industry leaders. A push to decarbonize trucking is largely due to the fact that more than 3% of all carbon dioxide (CO2) emissions come from heavy trucks. Better Diesel Fuel Economy Is An Efficient Form Of Decarbonization appeared first on CleanTechnica.
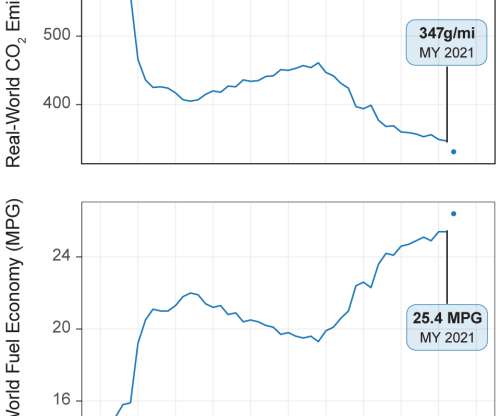
The US Environmental Protection Agency (EPA) released its annual Automotive Trends Report , which shows that model year (MY) 2021 vehicle fuel economy remained at a record high—but flat with MY 2020 fuel economy—while CO 2 emission levels reached a new record low. Estimated real-world fuel economy and CO 2 emissions.
The final report shows overall emissions in 2010 increased by 3.2% EPA attributes the trend to an increase in energy consumption across all economic sectors, due to increasing energy demand associated with an expanding economy, and increased demand for electricity for air conditioning due to warmer summer weather during 2010.
The European Union (EU) recently adopted CO 2 emissions mandates for new passenger cars, requiring steady reductions to 95 gCO 2 /km in 2021. We argue that assessment of the performance of the EU targets and alternatives should account for interactions of the transport sector with other energy sectors and with other parts of the economy.
US energy-related CO 2 emissions declined by 2.8% CO 2 emissions had increased by 2.9% Because of continuing trends in how much energy the US economy uses and how much CO 2 that energy use generates, energy-related CO 2 emissions in 2019 fell more than energy consumption, which declined by 0.9%
The US Environmental Protection Agency (EPA) “ Inventory of US Greenhouse Gas Emissions and Sinks: 1990-2010 ” draft report shows that in 2010, overall greenhouse gas (GHGs) emissions increased by 3.3% Total emissions from GHGs were about 6,866 million metric tons of CO 2 equivalent. from the previous year. the year before.
US energy-related CO 2 emissions decreased by 89 million metric tons (MMmt), from 5,259 MMmt in 2015 to 5,170 MMmt in 2016. over that period, other factors contributing to energy-related CO 2 emissions more than offset the growth in GDP, leading to a 1.7% decline in energy intensity of the economy (Btu/GDP). along with a 1.4%
Energy-related CO 2 emissions buy state, 2010. The US Energy Information Administration (EIA) has released a new report, State-Level Energy-Related Carbon Dioxide Emissions, 2000-2010. The report shows a significant variation of energy-related carbon dioxide emissions across states on both an absolute and a per capita basis.
Global CO 2 emissions from fossil fuel use and cement production reached a new all-time high in 2013, according to the annual report “Trends in global CO2emissions”, released by PBL Netherlands Environmental Assessment Agency and the European Joint Research Centre (JRC). The much lower emissions increase in China of 4.2%
The US Energy Information Administration (EIA) forecasts that US energy-related carbon dioxide (CO 2 ) emissions will decline by 11% in 2020. In EIA’s latest Short-Term Energy Outlook , US energy-related CO 2 emissions are forecast to fall more than the 5% decline in gross domestic product (GDP) in 2020. Source: U.S. Source: U.S.
The International Civil Aviation Organization (ICAO) has established a 2050 net-zero carbon dioxide emission goal for international aviation. Previous ICAO negotiations have focused on offsetting emissions growth above a 2020 baseline. Countries will develop national measures to cut emissions consistent with ICAO’s goal.
A new report from MIT’s Joint Program on the Science and Policy of Global Change suggests that a tax on carbon emissions could help raise the money needed to reduce the US deficit, while improving the economy, lowering other taxes and reducing emissions. —Rausch and Reilly (2012). —John Reilly.
Although a lightweight steel vehicle has a lower production phase environmental impact, those initial gains are erased by higher energy use and carbon emissions during the steel vehicle’s use phase, the study found. Emissions Fuel Efficiency Materials Weight reduction' Source: Sujit Das, ORNL. Click to enlarge. —Sujit Das.
ArcelorMittal Europe – Flat Products and Gonvarri Industries have signed a Memorandum of Understanding to cooperate more closely on reducing CO 2 emissions and strengthening both companies’ sustainability performance in the automotive market. The company has further committed to carbon neutrality by 2050.
A simulation based on the project results suggested that when 10% of all traffic in Beijing used DRGS, due to reduced traffic congestion, travel speed throughout the city would increase by approximately 10% and both fuel consumption and CO 2 emissions would decrease by approximately 10%. and increased fuel economy by 7.6% among users.
The US Energy Information Administration (EIA) reported that after an increase in 2010 of 3.3%, energy-related carbon dioxide emissions in the US in 2011 decreased by 2.4% (136 million metric tons), while GDP grew by 1.8%. This indicates that the carbon intensity of the economy declined by about 4.2%. per gallon.
In the US, Model Year (MY) 2018 vehicle fuel economy was 25.1 In model year 2018, the average estimated real-world CO2emission rate for all new vehicles fell by 4 grams per mile (g/mi) to 353 g/mi, the lowest level measured since 1975, when EPA data collection began. 0 g/mi—and highest fuel economy, at 113.7
This project is part of CEMEX’s Future in Action program to reduce its carbon footprint and contribute to a circular economy and an integral component of CEMEX’s master plan to develop a carbon neutral operation at its Rüdersdorf cement plant by 2030.
The closed-loop cycle allows for continuous catalyst replacement while emitting zero carbon dioxide emissions. For decades, PNNL scientists and engineers have led research using catalysts to reduce CO 2 emissions from industrial processes and transportation. GIF by Mike Perkins | Pacific Northwest National Laboratory).
The Scuderi Group released findings from a computer simulation study measuring the performance of the Scuderi split-cycle engine modeled against the European class of “high economy” vehicles. l/100 km with average CO 2 emissions of 104 g/km. liters per 100 km) while emitting 85 g CO 2 /km.
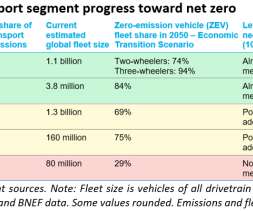
The road transport sector could still reach net-zero emissions by 2050 through electrification, but urgent action would be required from policymakers and industry participants, according to research company BloombergNEF’s (BNEF) latest annual Long-Term Electric Vehicle Outlook (EVO).
Countries seeking to meet Paris Agreement targets on CO 2 emissions must get a grip on the amount of pollution produced at city level, according to a new open-access study published in S cience Advances by an international team of researchers from Europe and China. Total CO 2 emissions of 182 Chinese cities. Shan et al.
Furthermore, the company said, it is of crucial importance for CO 2 emissions whether the propulsion energy is generated from fossil or regenerative sources. In the vehicle with an internal combustion engine, most of the emissions occur during the use phase—i.e., in the supply chain of the fossil fuel and the combustion.
Power management company Eaton has expanded its portfolio of valvetrain solutions for diesel off-highway vehicles to help OEMs reduce emissions and improve fuel economy. This technology enables precise valve lift control through HLA, coupled with engine braking capability, which in turn helps reduce emissions and improve fuel economy.
We organize all of the trending information in your field so you don't have to. Join 5,000+ users and stay up to date on the latest articles your peers are reading.
You know about us, now we want to get to know you!
Let's personalize your content
Let's get even more personalized
We recognize your account from another site in our network, please click 'Send Email' below to continue with verifying your account and setting a password.


Let's personalize your content