This site uses cookies to improve your experience. To help us insure we adhere to various privacy regulations, please select your country/region of residence. If you do not select a country, we will assume you are from the United States. Select your Cookie Settings or view our Privacy Policy and Terms of Use.
Cookie Settings
Cookies and similar technologies are used on this website for proper function of the website, for tracking performance analytics and for marketing purposes. We and some of our third-party providers may use cookie data for various purposes. Please review the cookie settings below and choose your preference.
Used for the proper function of the website
Used for monitoring website traffic and interactions
Cookie Settings
Cookies and similar technologies are used on this website for proper function of the website, for tracking performance analytics and for marketing purposes. We and some of our third-party providers may use cookie data for various purposes. Please review the cookie settings below and choose your preference.
Strictly Necessary: Used for the proper function of the website
Performance/Analytics: Used for monitoring website traffic and interactions
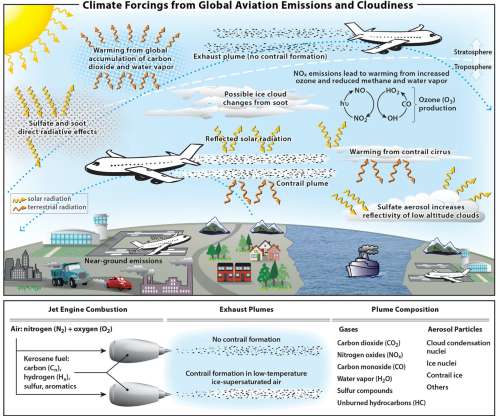
of the human-made climate impact; two-thirds of this impact are caused by emissions other than CO 2 , according to a new study by researchers in Europe and the US. Schematic overview of the processes by which aviation emissions and increased cirrus cloudiness affect the climate system. Aviation accounts for 3.5% —Lee et al.
New analysis has found increasing emissions of several ozone-depleting chemicals despite their production being banned for most uses under the Montreal Protocol—and a loophole in the rules is likely responsible. According to the researchers, emissions from these CFCs currently do not significantly threaten ozone recovery.
The decrease in CO 2 equivalent emissions of ODSs (ozone-depleting substances: CFCs, halons, HCFCs, and others) may be offset by the projected increase in their non-ozone depleting substitutes (HFCs) (lines designated as HFC scenarios). The contribution of HFCs to climate forcing is currently less than 1% of all greenhouse gases.
The climate change benefit is estimated for 2050 and human health and crop benefits are for 2030 and beyond. Black carbon and tropospheric ozone are harmful air pollutants that also contribute to climate change. Global benefits from full implementation of the identified measures in 2030 compared to the reference scenario.
Among the many climate-related vulnerabilities that can impact its mission, the US Environmental Protection Agency (EPA) cites a likely increase in tropospheric ozone pollution as potentially making it more difficult to attain National Ambient Air Quality Standards ( NAAQS ) in many areas with existing ozone problems.
Illustration of projected ozone changes in the South Coast region due to climate change in 2050. Areas in orange and red could see ozone concentrations elevated by 9 to 18 parts per billion. We already know that climate change will bring us increased forest fires, shorter winters, hotter summers and impact our water supply.
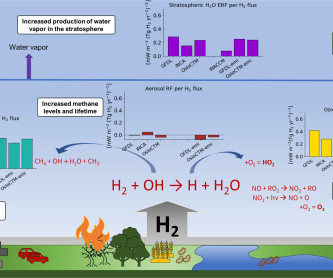
A study led by Norwegian climate center CICERO has found that the global warming effect of leaked hydrogen is almost 12 times stronger than that of CO 2. Rather, it is the leaking of hydrogen from production, transportation and usage that adds to global warming. The climate effects of hydrogen have been an under-researched topic.
A new study by led by Nadine Unger at NASA’s Goddard Institute for Space Studies (GISS) that analyzes the net climate impacts of emissions from economic sectors rather than by individual chemical species has found that on-road transportatation is and will be the greatest net contributor to atmospheric warming now and in the near term.
Ozone, the main component of smog, is a plant-damaging pollutant formed by emissions from vehicles, cooking stoves and other sources. New research shows that ozone pollution damaged millions of tons of wheat, rice, soybean and cotton crops in India in 2005. Surface ozone pollution in India damaged 6 million metric tons (6.7
Schematic diagram of the trade-offs between the implications for regional air quality and global climate change of new policies for management of the atmosphere. The project builds upon the idea that air quality and climate change issues are linked through “one atmosphere”, an approach that demands coordination and multi-tiered approaches.
Aviation climate change impacts pathway. An an example, they point out that an SPK fuel option with zero life cycle GHG emissions would offer a 100% reduction in GHG emissions but only a 48% reduction in actual climate impact using a 100-year time window and the nominal climate modeling assumptions in the paper.
CSIRO scientists have developed a new way to account for ozone in computer simulations of the climate. This latest modeling shows that the oceans take much less ozone out of the atmosphere than previously thought. Ozone (O 3 ) is formed by reactions of chemicals such as nitrogen oxides and volatile organic compounds—i.e.,
Currently, anthropogenic N 2 O emissions represent the largest contribution to ozone depletion. The study, published online 27 August in the journal Science , for the first time evaluated nitrous oxide emissions from human activities in terms of their potential impact on Earth’s ozone layer. Source: Ravishankara et al. TgCO 2 e, 9.7%).
Scientists from the US, Norway, Russia, Germany, Italy and China are participating in a study examining the potential role of black carbon, or soot, on the rapidly changing Arctic climate. The Arctic climate is changing faster than some scientists expected. The study will run through 15 May out of Svalbard, Norway.
the final version of the proposed First Update to the Climate Change Scoping Plan (First Update). Achieving our long-term climate goal and 2032 ozone standards will require a much deeper penetration of ZEVs into the fleet. The California Air Resources Board (ARB) has released. The draft version was released in February.
Compared to the 2010 “Business as Usual” scenario—which includes all adopted emission control measures for the South Coast—NO x levels must be reduced by 65% and by 75% to meet the 2023 and 2032 ozone standards, respectively. California’s Climate Protection Strategies do not help meet NAAQS Standards. Click to enlarge.
Policies incentivizing the private sector to push to develop innovative “clean” technologies are likely to play a key role in achieving climate stabilization. Respectively, Title IV of the 1990 Clean Air Act and the OzoneTransport Commission/NO x Budget Program.). c personnel and organizational innovative capacity. Margaret R.
The on-road transportation (ORT) and power generation (PG) sectors are major contributors to CO 2 emissions and a host of short-lived radiatively-active air pollutants, including tropospheric ozone and fine aerosol particles, that exert complex influences on global climate. Unger et al.
Mineta San José International Airport’s (SJC) has deployed a fleet of 10 Proterra battery-electric buses that will transport passengers and their luggage between SJC’s parking lots, rental car center, and terminals. The electric bus fleet is anticipated to reduce ozone emissions by 1.1
while the US GDP is projected to grow by 40%, according to the fifth National Communication on US climate change actions submitted by the US Department of State to the United Nations Framework Convention on Climate Change. The report projects that transportation-related CO 2 emissions will drop 1.5% to 7,416 Tg CO 2 Eq.,
Maersk Container Industry (MCI) is calling for tougher enforcement of European environmental legislation designed to protect the Earth’s ozone layer and help prevent climate change. Current EU legislation bans the “import” or “placing on the market” of reefer containers with significant potential to damage the climate and ozone layer.
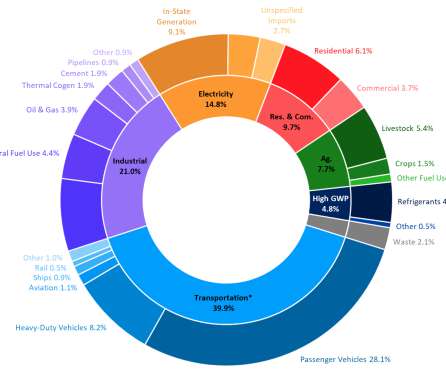
The transportation sector remains the largest source of GHG emissions in the state, and saw a 1% increase in emissions in 2017. Transportation sector emission sources include combustion of fuels utilized in-state that are used by on-road and off-road vehicles, aviation, rail, and water-borne vehicles, as well as a few other smaller sources.
This despite evidence that suggests air pollution impacts from the transportation sector exceed those from greenhouse gases. … Thus to fully account for the complexity of changes to air pollution chemistry, emission changes should be used to drive a chemical transport model (CTM). —Schnell et al. Seasons and times of day.
Temperature change per transport work by mode for various years after the emissions: per passenger kilometer for passenger travel (left) and per ton-kilometer for freight transport (right). Passenger travel with rail, coach or two- and three-wheelers has on average the lowest specific climate impact also on short time horizons.
GWP100 weighted specific climate impact (g CO 2 -eq per pkm) as a function of vehicle occupancy. A team from Austria and Norway has found that the climate impact from a long-distance trip (500–1,000 km, or 310–621 miles) can easily vary by a factor of 10 per passenger depending on mode choice, vehicle efficiency, and occupancy.
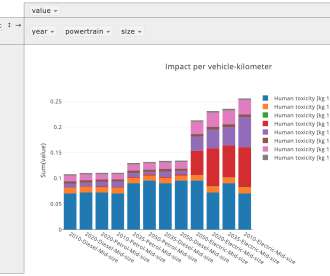
The system will graph lifecycle impact for a range of specified powertrains, for a large number of impact categories: Climate change [kg CO 2 -eq.]. Deterioration of the ozone layer [kg CFC-11-eq.]. The top sample above shows climate change impact; the subsequent chart shows human toxicity. Terrestrial toxicity [kg 1,4-DC.-eq.].
They found that reductions in ground ozone during this 35-year period resulted in $600 million in increased production annually by the early 2010s. Another difference is that some grains can be annually modified to withstand greater heat and even higher ozone levels in the air. An open-access paper on the work appears in Nature Food.
The design of the California cap-and-trade program allows linkage with programs established by partner jurisdictions in the Western Climate Initiative (WCI) to create a regional market system. Transportation fuels. For transportation fuel combustion emissions, the covered entity is the supplier of the fuel.
Using satellite observations (from the Atmospheric Chemistry Experiment Fourier Transform Spectrometer, ACE-FTS) and computer models, the research team determined that vigorous summertime circulation patterns associated with the Asian monsoon rapidly transport air upward from the Earth’s surface. William Randel.
Air quality co-benefits are additional to climate benefits realized from reduced CO 2 emissions.). In a paper published in the journal Nature Climate Science , the MIT researchers took a systems-level approach to analyzing how climate policies influence air quality, focusing on US emissions of O 3 and PM 2.5
However, emissions do not just remain in conurbations; particles and gaseous pollutants can be transported thousands of kilometers by the wind. The University of Bremen is the scientific base of the international project known as EMeRGe (Effect of Megacities on the transport and transformation of pollutants on the Regional and Global scales).
The UN Intergovernmental Panel on Climate Change (IPCC) released a policymaker’s summary of Working Group III’s (WG III) latest report showing that despite a growing number of climate change mitigation policies, annual anthropogenic GHG emissions grew on average by 1.0 Transport sector. WG III Summary for Policymakers.
The data shows a slight increase in overall emissions from the previous year, and a slight decline in emissions from transportation, which is the state’s main source of both GHGs and air pollutants. Transportation emissions declined 1.5 Source: California Air Resources Board (ARB). Total statewide 2018 GHG emissions were 425.3
The BAU scenario assumes no further implementing legislation to prevent additional climate change and growing air pollution, other than what is in place for the base year 2005. Northern India and the Arabian Gulf region, on the other hand, will suffer a marked increase in ozone levels.
Markey of the Energy and Environment Subcommittee on Tuesday released a draft of far-reaching energy and climate legislation that targets job creation, promotes renewables and energy efficiency, and places limits on emissions of greenhouse gases. Sections and provisions directly related to transportation are shaded.).
SAS involves dozens of other domestic and international research institutions, and is one of the largest North American air quality and climate studies in decades. SOAS objectives include the direct quantification of VOC, ozone and NO x surface fluxes and the reconciliation of differences with “blank-down” emission estimates.
NOAA’s updated Annual Greenhouse Gas Index (AGGI), which measures the direct climate influence of many greenhouse gases such as carbon dioxide and methane, shows a continued steady upward trend. It also includes several chemicals known to deplete Earth’s protective ozone layer, which are also active as greenhouse gases.
eutrophication; ET = ecological toxicity; FEC = fossil energy consumption; WU = water use; LO = land occupation; “The rest” includes acidification; smog formation; ozone layer depletion; and human health effects. GW = global warming; Eut. Credit: ACS, Yang et al. Click to enlarge.
That’s three times the amount estimated by the Intergovernmental Panel on Climate Change (IPCC). Nitrous oxide is a potent greenhouse gas that contributes to climate change and stratospheric ozone destruction. This multi-site experiment clearly establishes streams and rivers as important sources of nitrous oxide.
Sustainable Communities : The Sustainable Communities and Climate Protection Act of 2008 (SB 375) directs California’s metropolitan planning organizations to develop sustainable communities strategies that meet regional greenhouse gas reduction targets through integrated land use, housing and transportation planning.
The regulation will cover 360 businesses representing 600 facilities and is divided into two broad phases: an initial phase beginning in 2012 that will include all major industrial sources along with utilities; and, a second phase that starts in 2015 and brings in distributors of transportation fuels, natural gas and other fuels.
The cap-and-trade joins a suite of other major climate program measures including standards for ultra-clean cars (Advanced Clean Cars, earlier post ), low-carbon fuels (Low Carbon Fuel Standard, earlier post ) and renewable electricity. the second, starting in 2015, brings in distributors of transportation fuels, natural gas and other fuels.
Funding priorities through the ARFVT Program support fuel and vehicle development to help attain the state’s climate change policies. Currently, the state’s transportation sector accounts for nearly 40% of the state''s greenhouse gas emissions; more than 95% of all transportation energy consumed in California is petroleum-based.
Health and other non-climate damages by life-cycle component for different combinations of fuels and light-duty automobiles in 2005 (top) and 2030 (bottom). Transportation, which today relies almost exclusively on oil, accounts for nearly 30% of US energy demand. Damages are expressed in cents per VMT (2007 USD). Click to enlarge.
We organize all of the trending information in your field so you don't have to. Join 5,000+ users and stay up to date on the latest articles your peers are reading.
You know about us, now we want to get to know you!
Let's personalize your content
Let's get even more personalized
We recognize your account from another site in our network, please click 'Send Email' below to continue with verifying your account and setting a password.


Let's personalize your content