This site uses cookies to improve your experience. To help us insure we adhere to various privacy regulations, please select your country/region of residence. If you do not select a country, we will assume you are from the United States. Select your Cookie Settings or view our Privacy Policy and Terms of Use.
Cookie Settings
Cookies and similar technologies are used on this website for proper function of the website, for tracking performance analytics and for marketing purposes. We and some of our third-party providers may use cookie data for various purposes. Please review the cookie settings below and choose your preference.
Used for the proper function of the website
Used for monitoring website traffic and interactions
Cookie Settings
Cookies and similar technologies are used on this website for proper function of the website, for tracking performance analytics and for marketing purposes. We and some of our third-party providers may use cookie data for various purposes. Please review the cookie settings below and choose your preference.
Strictly Necessary: Used for the proper function of the website
Performance/Analytics: Used for monitoring website traffic and interactions
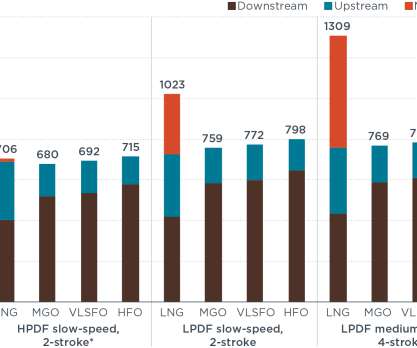
The results of a new analysis by the International Council on Clean Transportation (ICCT) show that, when combined with a trend toward higher methane leakage and combustion slip, there is no climate benefit from using liquefied natural gas (LNG) as a marine fuel—regardless of the engine technology. First, it contains very little sulfur.
A new study by the International Council on Clean Transportation (ICCT) estimates heavy fuel oil (HFO) use, HFO carriage, the use and carriage of other fuels, black carbon (BC) emissions, and emissions of other air and climate pollutants for the year 2015, with projections to 2020 and 2025. Click to enlarge. —Comer et al.
Marine shipping fuels will get cleaner in 2020 when a regulation by the International Maritime Organization (IMO) requires a decrease in the allowable amount of sulfur in fuel oil from 3.5% Some key regions include China, Singapore, Panama, Brazil and coastlines of Asia, Africa and South America. —i.e., Reduction in annual PM 2.5
Container ships (23%), bulk carriers (19%) and oil tankers (13%) accounted for more than half of CO 2 emissions. Ships registered to Panama (15%), China (11%), Liberia (9%), Marshall Islands (7%), Singapore (6%), and Malta (5%) were the largest emitters. International shipping was not included in the 2015 Paris climate agreement.
That study provided estimates of vessel traffic (numbers of vessels and transits) based on modeling of current vessel activity patterns, growth potential, and vessel projection scenarios, including diversion from other routes, and oil and gas development. The emissions report focuses on the low- and mid-range diversion scenarios—i.e.,
It is also flex so that future biomass fuels such as cellulosic ethanol, methanol can be used (no oil). Also maintenance on these (no oil changes to speak of) etc will cost much less than an internal combution propelled car. Those cars will reduce oil demand at most by about 1/5th of one percent. — Volt Enthusiast 7.
Incremental well-to-wheels GHG emissions from WCSB Oil Sands Crudes Compared to Well-to-Wheels GHG Emissions from Displacing Reference Crudes Click to enlarge. Domestic production of crude oil has increased significantly, from approximately 5.5 million bpd in 2010 to 6.5 million bpd in 2012 and 7.5 million bpd by mid-2013. million bpd.
We organize all of the trending information in your field so you don't have to. Join 5,000+ users and stay up to date on the latest articles your peers are reading.
You know about us, now we want to get to know you!
Let's personalize your content
Let's get even more personalized
We recognize your account from another site in our network, please click 'Send Email' below to continue with verifying your account and setting a password.


Let's personalize your content