This site uses cookies to improve your experience. To help us insure we adhere to various privacy regulations, please select your country/region of residence. If you do not select a country, we will assume you are from the United States. Select your Cookie Settings or view our Privacy Policy and Terms of Use.
Cookie Settings
Cookies and similar technologies are used on this website for proper function of the website, for tracking performance analytics and for marketing purposes. We and some of our third-party providers may use cookie data for various purposes. Please review the cookie settings below and choose your preference.
Used for the proper function of the website
Used for monitoring website traffic and interactions
Cookie Settings
Cookies and similar technologies are used on this website for proper function of the website, for tracking performance analytics and for marketing purposes. We and some of our third-party providers may use cookie data for various purposes. Please review the cookie settings below and choose your preference.
Strictly Necessary: Used for the proper function of the website
Performance/Analytics: Used for monitoring website traffic and interactions
A multi-Hubbert analysis of coal production by Tadeusz Patzek at The University of Texas at Austin and Gregory Croft at the University of California, Berkeley concludes that the global peak of coal production from existing coalfields will occur close to the year 2011. The CO 2 emissions from burning this coal will also decline by 50%.
Projected changes in summer mean usable capacity of power plants in the US and Europe for the SRES A2 emissions scenario for the 2040s (2031–2060) relative to the control period (1971–2000). A study published in Nature ClimateChange suggests that thermoelectric power plants (i.e., Source: van Vliet et al. Click to enlarge.
A) CNG light-duty cars vs. gasoline cars; (B) CNG heavy-duty vehicles vs. diesel vehicles; and (C) combined-cycle natural gas plants vs. supercritical coal plants using low-CH 4 coal. Recent reports in the scientific literature and popular press have produced confusion about the climate implications of natural gas.
This article shows that including offsets in climatechange legislation would likely make an emissions program more cost-effective by: (a) providing an incentive for non-regulated sources to generate emission reductions; and (b) expanding emission compliance opportunities for regulated entities. Assuming the offset is legitimate—i.e.,
This decrease was driven largely by a decrease in emissions from fossil fuel combustion resulting from a decrease in total energy use in 2019 compared to 2018 and a continued shift from coal to natural gas and renewables in the electric power sector. CO 2 emissions decreased 2.2% from 2018 to 2019.
My favorite part of this next CicLaVia is t he Bike Parade coming from my friends at Greenpeace and Sierra Club which they’re calling ROLL AGAINST COAL. In case you didn’t know, the City of Los Angeles still gets 40% of its electricity from coal-fired power plants, the dirtiest polluters and greenhouse gassers on the planet.
” “ Some have even suggested that coal state representatives in Washington should block any advancement of national health care reform legislation until the coal industry’s demands are met by the EPA, ”, wrote Byrd. West Virginia is home to about 22,000 coal miners, down from 62,500 in 1979.
The US Department of Energy (DOE) in partnership with the US Air Force has issued a request for information (RFI)— DE-FOA-0000981 —on research & development aimed at greenhouse gas emissions reductions and cost competitiveness of Mil-Spec jet fuel production using coal-to-liquid (CTL) fuel technologies. Information Request.
Simple, effective solutions that can help lessen the impact of climatechange already exist. Rahman, a power expert and professor of electrical and computer engineering at Virginia Tech , is the former chair of the IEEE ad hoc committee on climatechange. One type is the ultrasupercritical coal-fired steam power plant.
The global energy supply became 6% cleaner from 1971 to 1990,in response to the oil shocks of the 1970s. Since 1990, however, the ESCII (2010 = 100) has remained essentially static, changing by less than 1%. In 1990 the underlying carbon intensity of supply was 57.1 tCO 2 /TJ (2.39 tCO 2 /toe); in 2010 it was 56.7 tCO 2 /toe).
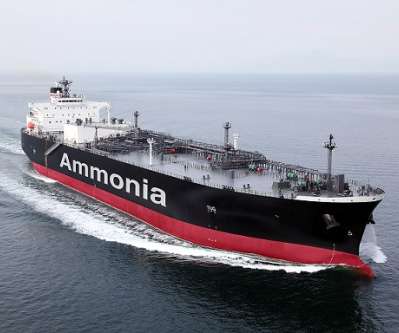
In particular, a significant reduction in CO 2 emissions is expected to be achieved by replacing coal and natural gas as the main fuels for power generation. These technologies are aimed at generating electricity by co-firing ammonia at coal-fired power stations. Ammonia floating storage and regasification barge (A-FSRB).
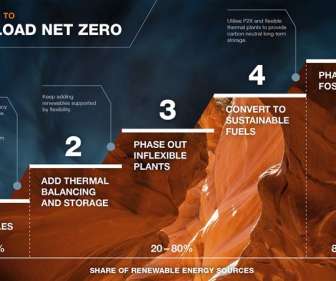
The technology group Wärtsilä has issued a report ahead of COP26, the UN’s ClimateChange Conference to be held in Glasgow this autumn, describing the environmental and economic opportunities for states that decarbonize rapidly. coal and gas), significantly reducing the overall levelised cost of electricity.
The smartest scientists on the face of the planet, the ones studying climatechange and global warming, are mad as hell and they’re not going to take it any more. And I’m just the guy to tell that truth whether you want to hear it or not. That’s because I know the fate that awaits all of these enemies of our future.
In regions where the share of coal-based electricity is relatively low, EVs can achieve substantial GHG reduction, the team reports in a paper in the ACS journal Environmental Science & Technology. According to the 12 th Five-Year Plan of the China Coal Industry (2011?2015)
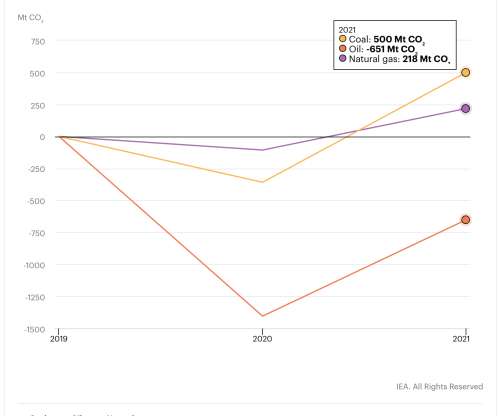
billion tonnes, their highest ever level, as the world economy rebounded strongly from the COVID-19 crisis and relied heavily on coal to power that growth, according to new IEA analysis. Coal accounted for over 40% of the overall growth in global CO 2 emissions in 2021, reaching an all-time high of 15.3 billion tonnes.
This reactor’s innovative features include the use of natural circulation and passive cooling systems, which are designed to cool the nuclear fuel under all conditions without the need for external power or external water supply for extended periods. A single SMR of about 300 megawatts in size can prevent between 0.3
However, fossil fuels continue to supply nearly 80% of world energy use through 2040. Natural gas is the fastest-growing fossil fuel, as global supplies of tight gas, shale gas, and coalbed methane increase. per year over the projection period, but remain a relatively minor share of total liquids supply through 2040.
Nevertheless, for EVs themselves to become true zero emission vehicles, everything in their supply chain from mining to electricity production must be nearly net-zero emission as well. In states (or countries ) with a high proportion of coal-generated electricity, the miles needed to break-even climb more.
Canada’s First Ministers (The Prime Minister of Canada and the provincial and territorial premiers) issued a joint communiqué and released the Pan-Canadian Framework on Clean Growth and ClimateChange following the First Ministers’ Meeting. The Framework outlines actions that will grow the economy while reducing GHG emissions.
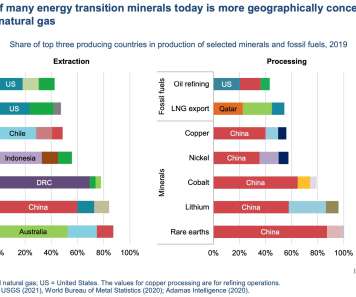
Demand outlooks and supply vulnerabilities vary widely by mineral, but the energy sector’s overall needs for critical minerals could increase by as much as six times by 2040, depending on how rapidly governments act to reduce emissions. However, in climate-driven scenarios, these positions are reversed well before 2040. Source: IEA.
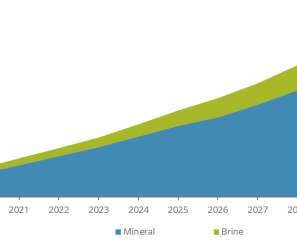
Roskill’s new Sustainability Monitor, and subsequent White Paper, analyze the energy consumption and CO 2 emissions of the lithium supply chain. Using this, Roskill has been able to produce detailed energy and emissions intensity curves of the lithium supply chain.
The MIT Energy Initiative has released a new report on reducing carbon dioxide emissions from existing coal plants. There is no credible pathway toward prudent greenhouse gas stabilization targets without CO 2 emissions reduction from existing coal power plants. We may not see a strong CO 2 price signal for many years.
The power sector has become less carbon-intensive as natural gas-fired generation displaced coal-fired and petroleum-fired generation and as the noncarbon sources of electricity generation—especially renewables such as wind and solar—have grown.
The Excel-based Upstream Dashboard provides “upstream” data for lifecycle analysis of coal, natural gas, crude oil, uranium, and biomass, as well as gasoline, ethanol, jet fuel, and diesel derived from either petroleum or coal-gasification. Results are listed in a chart as well as illustrated in a bar graph.
The decrease was driven by the economic downturn, combined with a significant switch from coal to natural gas as a source of electricity generation, according to the EIA. decline in coal-based CO 2 emissions for 2009. Increases in coal consumption, primarily in the electric power sector, is expected to lead to a 1.1%
This is not an easy challenge, especially when we aim to introduce new technologies such as the Wind Challenger, so it is extremely encouraging to have Enviva as our partner, whose core mission is to fight climatechange, and with their passion and determination, have proved that they can make a difference.
Preparing the US for the impacts of climatechange. Preparing the US for the impacts of climatechange. billion in FY 2014 budget); Assessing climate-change impacts in the United States; Launching a climate data initiative; and. Providing a toolkit for climate resilience.
My favorite part of this next CicLaVia is t he Bike Parade coming from my friends at Greenpeace and Sierra Club which they’re calling ROLL AGAINST COAL. In case you didn’t know, the City of Los Angeles still gets 40% of its electricity from coal-fired power plants, the dirtiest polluters and greenhouse gassers on the planet.
million) toward a $30-million underground coal gasification (UCG) project with Swan Hills Synfuels of Calgary. Swan Hills Synfuels expects the project to demonstrate the ability to manufacture synthetic gas from Alberta’s coal resources, with the future potential of utilizing the coal seams for carbon capture and storage.
As we have pointed above, ENI has the most ambitious climatechange pledge with plans to lower its greenhouse gas emissions by 80% by 2050. Natural gas does produce about 28% less CO2 emissions than heating oil and 50% less than coal for the same amount of energy when burned.
This was the result of growing renewable power generation, switches from coal to natural gas, improvements in energy efficiency, as well as structural changes in the global economy. The decline was driven by a surge in shale gas supplies and more attractive renewable power that displaced coal.
and the carbon intensity of the energy supply (carbon dioxide per unit of energy consumed) declined by 2.3%. The large decline in emissions was driven by the economic downturn, combined with an ongoing trend toward a less energy-intensive economy and a decrease in the carbon-intensity of the energy supply. between 2008 and 2009.
—Leo Johnson, Partner, Sustainability and ClimateChange, PwC. The risk to business is that it faces more unpredictable and extreme weather, and disruptions to market and supply chains. Resilience will become a watch word in the boardroom—to policy responses as well as to the climate.
The report was developed based on the assumptions that: Energy consumption will continue to grow and in particular, liquid fossil fuels will remain a significant part of the US energy supply for the next quarter century and more. Demand for liquid fossil fuels will require the US. Demand for liquid fossil fuels will require the US.
Decomposition of the decadal change in total global CO 2 emissions from fossil fuel combustion by four driving factors; population, income (GDP) per capita, energy intensity of GDP and carbon intensity of energy. Increased use of coal relative to other energy sources has reversed the long?standing WG III Summary for Policymakers.
There were small percentage increases in emissions of other greenhouse gases, but their absolute contributions to the change in total emissions were relatively small, with the increase in emissions of those gases being more than offset by the drop in CO 2 emissions: 14.8 Tags: ClimateChange Emissions. MMTCO 2 e in 2008.
“Pack Up Your Toxic, Fossil Fuel Factory With Its Climate-Changing Products & Get Out of Town By 2020!&# is also the very same company that has paid tens of millions of dollars, year after year to spread FUD about their role in climatechange. Greenius Rules. Uncertainty. So that refinery much go. Start packing.
If cap-and-trade in the United States were to become reality along the lines of proposals now before Congress, up to 2 billion of the new credits would be drawn from carbon offsets, potentially increasing the worldwide supply of such credits by a factor of seven. Intergovernmental Panel on ClimateChange, ClimateChange 2007: Mitigation.
We have joined the global battle to defeat climatechange. Our aim is to provide the two “missing links” in the climatechange battle, to create both the demand and the supply of green hydrogen. Once established, these advances will also substantially reduce Fortescue’s operating costs.
The five different fuel groups were those derived: from conventional petroleum; from unconventional petroleum; synthetically from natural gas, coal, or combinations of coal and biomass via the FT process; renewable oils; and alcohols. Weiss, Ian A. Waitz (2009) Near-Term Feasibility of Alternative Jet Fuels (TR-554-FAA).
Shale gas drilling in the UK has been given the go-ahead by MPs in a new report looking at the impact it could have on water supplies, energy security and greenhouse gas emissions. However, it will not be sufficient to meet long term emissions reductions targets and avoid the worst effects of global climate disruption.
In Alberta, for example, CO 2 emissions from coal-fired electric power exceed emissions from oil sands and the costs of reducing emissions from coal electricity are lower. Yet, coal-fired emissions in Alberta receive relatively little attention from environmental organizations and the public. Why then the focus on oil sands?
The commitment was made as part of wider efforts by the global energy industry to ensure that natural gas continues to play a critical role in helping meet future energy demand while addressing climatechange. —Tim Gould, Head of Supply Division, World Energy Outlook, IEA.
For example, some states are located near abundant hydroelectric supplies, while others contain abundant coal resources. The states with the lowest carbon intensity of economic activity are also states that appear on the lower end of both energy intensity and the carbon intensity of that energy supply. Click to enlarge.
We organize all of the trending information in your field so you don't have to. Join 5,000+ users and stay up to date on the latest articles your peers are reading.
You know about us, now we want to get to know you!
Let's personalize your content
Let's get even more personalized
We recognize your account from another site in our network, please click 'Send Email' below to continue with verifying your account and setting a password.


Let's personalize your content