This site uses cookies to improve your experience. To help us insure we adhere to various privacy regulations, please select your country/region of residence. If you do not select a country, we will assume you are from the United States. Select your Cookie Settings or view our Privacy Policy and Terms of Use.
Cookie Settings
Cookies and similar technologies are used on this website for proper function of the website, for tracking performance analytics and for marketing purposes. We and some of our third-party providers may use cookie data for various purposes. Please review the cookie settings below and choose your preference.
Used for the proper function of the website
Used for monitoring website traffic and interactions
Cookie Settings
Cookies and similar technologies are used on this website for proper function of the website, for tracking performance analytics and for marketing purposes. We and some of our third-party providers may use cookie data for various purposes. Please review the cookie settings below and choose your preference.
Strictly Necessary: Used for the proper function of the website
Performance/Analytics: Used for monitoring website traffic and interactions
Global benefits from full implementation of the identified measures in 2030 compared to the reference scenario. Black carbon and tropospheric ozone are harmful air pollutants that also contribute to climate change. The identified measures complement, but do not replace, anticipated carbon dioxide reduction measures.
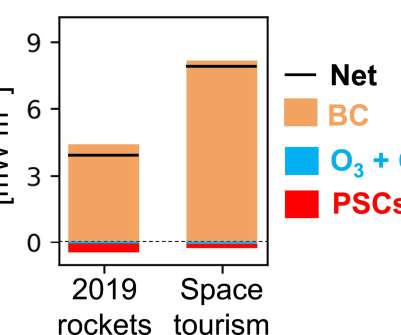
The rapidly growing space industry may have a greater climate effect than the aviation industry and undo repair to the protective ozone layer if left unregulated, according to a new study led by UCL and published in the journal Earth’s Future as an open-access paper. The space industry is one of the world’s fastest growing sectors.
Researchers in France have found that ozone depletion above Antarctica has significantly reduced the Southern Ocean’s ability to absorb atmospheric CO 2 and has also accelerated acidification of southern polar waters, despite lesser CO 2 uptake. billion tons of carbon was not taken up by the oceans. Earlier post.)
Relying more on natural gas would reduce emissions of carbon dioxide, but it would do little to help solve the climate problem. It would be many decades before it would slow down global warming at all, and even then it would just be making a difference around the edges. —Tom Wigley. degree Fahrenheit (less than 0.1
Through a recent modeling experiment, a team of NASA-funded researchers have found that future concentrations of carbon dioxide and ozone in the atmosphere and of nitrogen in the soil are likely to have an important but overlooked effect on the cycling of water from sky to land to waterways. Credit: NASA. Click to enlarge.
Net warming from NO x emissions is a sum over warming (short-term ozone increase) and cooling (decreases in methane and stratospheric water vapor, and a long-term decrease in ozone) terms. These contributions involve a large number of chemical, microphysical, transport and, radiative processes in the global atmosphere.
CSIRO scientists have developed a new way to account for ozone in computer simulations of the climate. This latest modeling shows that the oceans take much less ozone out of the atmosphere than previously thought. Ozone (O 3 ) is formed by reactions of chemicals such as nitrogen oxides and volatile organic compounds—i.e.,
Led by the tiny Pacific island of the Federated States of Micronesia, a growing group of low-lying islands and other vulnerable countries are calling for fast action on the approximately 50% of global warming that is caused by pollutants other than carbon dioxide (CO 2 ). million lives lost each year due to black carbon soot.
At 2:56 AM PST today, NASA’s Orbiting Carbon Observatory 2 (OCO-2) was successfully launched into orbit from Space Complex 2 West at California’s Vandenberg Air Force Base, riding on a two-stage Delta II 7320-10 launch vehicle. by Jack Rosebro. This measurement is unique like a fingerprint, and can be used for identification.
Renault’s comparison of the carbon footprint of EV and ICE vehicles over production, operation and end of life. Renault selected six environmental indicators for the LCA: Global Warming 100yr Potential (kg CO 2 equivalent). in the atmosphere and consequently of global warming potential. The EV footprint (Fluence Z.E.)
Following this BAU scenario, the researchers projected that air quality for the global average citizen in 2050 would be almost comparable to that for the average citizen in East Asia in the year 2005—an outcome which underscores the need to pursue emission reductions, according to the authors. —Pozzer et al.
Average annual percentage of black carbon pollution related to Chinese exports. China is responsible for only a small percentage of the annual pollution in the US, but powerful global winds known as “westerlies” can push airborne chemicals across the ocean in days, particularly during the spring, causing dangerous spikes in contaminants.
The US Environmental Protection Agency (EPA) has submitted its final Report to Congress on Black Carbon , in response to an October 2009 request from Congress to advance efforts to understand the role of black carbon (BC) in climate change. —Report to Congress on Black Carbon. Source: EPA. Click to enlarge. Earlier post.).
The US, Canada, and Mexico have submitted a proposal to strengthen climate protection under the Montreal Protocol— the international treaty that phases out the production of a number of substances responsible for ozone depletion. Uncontrolled growth of HFCs will offset the benefits of reducing carbon dioxide. Source: IGSD.
The decrease in CO 2 equivalent emissions of ODSs (ozone-depleting substances: CFCs, halons, HCFCs, and others) may be offset by the projected increase in their non-ozone depleting substitutes (HFCs) (lines designated as HFC scenarios). Climate and the Ozone Layer. Source: UNEP. Click to enlarge.
Global average values for the year 2000. A new study comparing both the absolute and normalized climate impacts of current passenger and freight transportation finds that driving a car increases global temperatures in the long run more than making the same long-distance journey by air. Bars represent 1 SD. Click to enlarge.
The European Parliament is calling for fast action to reduce non-CO 2 climate forcers including black carbon soot, hydrofluorocarbons (HFCs), methane, and ground-level ozone, which together are responsible for nearly half of climate forcing. Because these climate forcers are short-lived, reducing them produces a fast climate response.
While they do not deplete the ozone layer, many are highly potent greenhouse gases whose use is growing rapidly as replacements for ozone-depleting substances being phased out under the Montreal Protocol. Left unabated, HFC emissions could grow to nearly 20% of carbon dioxide emissions by 2050, a serious climate mitigation concern.
The 100-year global warming potentials (GWPs) for methane, CO, and NO x (per Tg N) as given in the AR4 and in this study when including no aerosol response; the direct radiative effect of aerosol responses; and the direct+indirect radiative effects of aerosol responses. Source: Shindell at al. Click to enlarge. Shindell et al.
A global phase down of HFCs could potentially reduce some 90 gigatons of CO 2 equivalent by 2050, equal to roughly two years worth of current global greenhouse gas emissions. While they do not deplete the ozone layer, many are highly potent greenhouse gases.
On a per-storage basis, the team found that the NiMH technology was found to have the highest environmental impact, followed by NCM and then LFP, for all categories considered except ozone depletion potential. They also found higher life cycle global warming emissions than have been previously reported. —Majeau-Bettez et al.
This new global emission estimate is startling. Nitrous oxide is a potent greenhouse gas that contributes to climate change and stratospheric ozone destruction. The global warming potential of nitrous oxide is 300-fold greater than carbon dioxide; nitrous oxide accounts for some 6% of human-induced climate change, scientists estimate.
Earlier in December, ARB announced that the American Carbon Registry and the Climate Action Reserve had been formally approved as offset project registries to help evaluate compliance-grade carbon offsets under California’s cap-and-trade program. Destruction of Ozone Depleting Substances. Urban forestry. Dairy manure digesters.
Ethane reacts with sunlight and other molecules in the atmosphere to form ozone, which at the surface can cause respiratory problems, eye irritation and other ailments and damage crops. And they’re sufficient to explain much of the global shift in ethane concentrations. Hydrocarbons react with NO x and sunlight to produce ozone.
The exponentially increasing global market share of EVs has prompted research on their efficacy in reducing greenhouse gases, but comparatively little effort has focused on their impact on air quality. Among the findings: Summer surface ozone (O 3 ) decreases in most locations due to widespread reductions of traffic NO x emissions.
A new study quantifying emissions from a fleet of gasoline direct injection (GDI) engines and port fuel injection (PFI) engines finds that the measured decrease in CO 2 emissions from GDIs is much greater than the potential climate forcing associated with higher black carbon emissions from GDI engines. —Saliba et al. versus 6.3 ± 1.1
used a climate model to analyze the effects of a wide range of chemical species, including carbon dioxide, nitrous oxide, methane, organic carbon, black carbon, nitrate, sulfate, and ozone, from 13 sectors of the economy from 2000 to 2100. Nadine Unger. Unger et al.
Cutting HFCs, black carbon, tropospheric ozone, and methane can buy us about 40 years before we approach the dangerous threshold of 2°C warming. —co-author HFCs are powerful greenhouse gases originally developed as substitutes for ozone-depleting chemicals. Black Carbon. From Molina et al. Earlier post.) Mario Molina. (Dr.
Carbon dioxide accounted for 80% of this increase. After water vapor, the three most prevalent long-lived greenhouse gases are carbon dioxide, methane and nitrous oxide. Nitrous oxide contributes about 6% to the overall global increase in radiative forcing since 1750. It has grown at an average of about 0.75 Earlier post.).
HFCs are synthetic gases that are used in a variety of applications, but mainly to replace ozone-depleting substances in aerosols, foams, refrigeration and air-conditioning. Technology exists that makes it possible for new facilities to use refrigerants with very low-GWP today, such as carbon dioxide or ammonia.
NOAA’s updated Annual Greenhouse Gas Index (AGGI), which measures the direct climate influence of many greenhouse gases such as carbon dioxide and methane, shows a continued steady upward trend. NOAA scientists created the AGGI recognizing that carbon dioxide is not the only greenhouse gas affecting the balance of heat in the atmosphere.
The researchers believe the measurements will substantially impact the understanding of atmospheric chemistry mechanisms—in particular, in the more rapid formation of secondary aerosols, important in the formation of local smog as well as in global climate change. —Welz et al. —Marston (2012).
Percent reduction in visible solar energy due to ambient PM (plus a small contribution from ozone) (A), only dust PM deposition (B) deposition of all PM components (C), and atmospheric and deposited combined (D; note change in scale). Credit: ACS, Bergin et al. Click to enlarge. So we put together a comprehensive model to do just that.
Shipping-induced global temperature change in 2050 using different parameterizations of Indirect Aerosol Effect (IAE). Other than these emissions from combustion associated with main engines and boilers, there are also emissions of ozone-depleting substances (CFCs/HCFCs/ HFCs) from refrigerant and air conditioning systems.
Although viewed as a potential target in the global effort to reduce climate change, atmospheric black carbon particles absorb significantly less sunlight than scientists have predicted, according to a new study by an international team of researchers, published in the journal Science. Earlier post.). Earlier post.).
The data are updated monthly from analyses of air measurements at Cape Grim, which, under baseline conditions, experiences some of the cleanest air in the world and accurately reflects global changes in greenhouse gases. Data for the synthetic greenhouse and ozone depleting gases, such as CFCs, also are available.
Specifically, the proposed rule updates the current prohibition under section 608 of the Clean Air Act against knowingly venting, releasing or disposing of ozone-depleting (ODS) and substitute refrigerants and extends the requirements, as appropriate, to non-ozone-depleting substitute refrigerants, such as hydrofluorocarbons (HFCs).
Sharkey’s research team already has measured rates of isoprene emission from plants that are used by the Environmental Protection Agency to predict lower-atmosphere ozone levels. His team also has created models to measure how much isoprene plants release on a global scale. With the enzyme, Sharkey has made bio-isoprene using bacteria.
Ocean acidification caused by the absorption of carbon dioxide in seawater is already increasing along the California coast decades earlier than existing models predict. The growth in carbon dioxide emissions from energy and industry has exceeded even the most fossil-fuel intensive scenario developed by the IPCC at the end of the 1990s.
The short-lived climate pollutants (also called super pollutants) include black carbon, a primary component of soot; tropospheric ozone, the principle component of urban smog; methane; and hydrofluorocarbons (HFCs). C in projected cumulative warming by 2050 and 1.1 °C C or more projected warming by 2100, IGSD says.
Schematic diagram of the trade-offs between the implications for regional air quality and global climate change of new policies for management of the atmosphere. The complex roles that ozone and aerosols play in the atmosphere provide examples of such trade-offs. Source: NOAA. Click to enlarge. emission inventories?
Decomposition of the decadal change in total global CO 2 emissions from fossil fuel combustion by four driving factors; population, income (GDP) per capita, energy intensity of GDP and carbon intensity of energy. giga tonne carbon dioxide equivalent (GtCO 2 eq) (2.2%) per year from 2000 to 2010 compared to 0.4 Click to enlarge.
The finding helps advance research into ammonia as an alternative to carbon-based fuels for cars, airplanes, and power generation facilities. Although the space and time-averaged emission (STAE) of NO was found to decrease with increase in the global equivalence ratio (global ?) Left: Vortex structures of swirling flows.
The Volkswagen Group announced that it is choosing CO 2 as the future low global warming potential (GWP) refrigerant for its mobile air conditioning (MAC) systems. With a GWP (Global Warming Potential) value of 1, R744 is 99.3% Earlier post.). Earlier post.). below the EU’s now-specified GWP limit of 150 for MAC systems.
We organize all of the trending information in your field so you don't have to. Join 5,000+ users and stay up to date on the latest articles your peers are reading.
You know about us, now we want to get to know you!
Let's personalize your content
Let's get even more personalized
We recognize your account from another site in our network, please click 'Send Email' below to continue with verifying your account and setting a password.


Let's personalize your content