Remove 2017 Remove Global Remove Ozone Remove Transportation
article thumbnail

California 2017 GHG inventory shows 1.2% total drop from 2016; transportation sector emissions up 1%

Green Car Congress

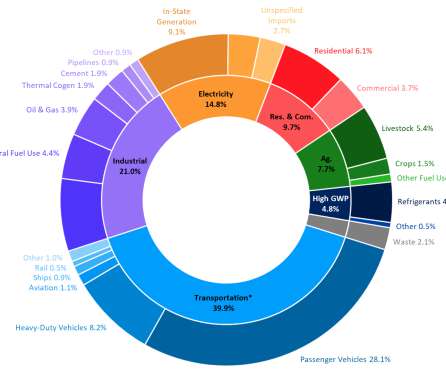
In 2017, emissions from GHG emitting activities statewide were 424 million metric tons of CO 2 equivalent (MMTCO 2 e), 5 MMTCO 2 e lower than 2016 levels and 7 MMTCO 2 e below the 2020 GHG Limit of 431 MMTCO 2 e. Changes in emissions by Scoping Plan sector between 2000 and 2017. MMTCO 2 e (6%) from 2013 to 2017. Source: ARB.

2017 230
article thumbnail

Study links ambient PM2.5 and ozone specifically caused by vehicle exhaust emissions to ~361,000 premature deaths worldwide in 2010 and ~385,000 in 2015

Green Car Congress

A new study provides the most detailed picture available to date of the global, regional, and local health impacts attributable to emissions from four transportation subsectors: on-road diesel vehicles; other on-road vehicles; shipping; and non-road mobile engines such as agricultural and construction equipment. of global ambient PM 2.5

Ozone 230
article thumbnail

CSIRO study finds ozone uptake in oceans much lower than previously thought

Green Car Congress

CSIRO scientists have developed a new way to account for ozone in computer simulations of the climate. This latest modeling shows that the oceans take much less ozone out of the atmosphere than previously thought. Ozone (O 3 ) is formed by reactions of chemicals such as nitrogen oxides and volatile organic compounds—i.e.,

Ozone 150
article thumbnail

Satellite method provides insight into ozone-NOx-VOCs sensitivity for different locations

Green Car Congress

Ozone pollution near Earth’s surface is one of the main ingredients of summertime smog. It is also not directly measurable from space due to the abundance of ozone higher in the atmosphere, which obscures measurements of surface ozone. —Jin et al.

Ozone 150
article thumbnail

Latest GHG Inventory shows California remains below 2020 emissions target; much steeper rate of GHG reductions required

Green Car Congress

The California Air Resources Board released GHG emissions data for 2018 showing that emissions remain below 1990 levels but are effectively flat compared to 2017, while the economy grew by 4.3%. million metric tons in 2017. Transportation emissions declined 1.5 Source: California Air Resources Board (ARB). tons per person to 10.7

2020 221
article thumbnail

HALO research aircraft measuring the emissions of megacities in EmeRGe project

Green Car Congress

However, emissions do not just remain in conurbations; particles and gaseous pollutants can be transported thousands of kilometers by the wind. The University of Bremen is the scientific base of the international project known as EMeRGe (Effect of Megacities on the transport and transformation of pollutants on the Regional and Global scales).

Emissions 268
article thumbnail

HEI: 95%+ of world’s population live in areas of unhealthy air

Green Car Congress

Seven billion people, more than 95% of the world’s population, lived in areas exceeding the WHO Guideline for healthy air in 2016, according to a new global study. State of Global Air 2018. Population-weighted seasonal average ozone concentrations in 2016. State of Global Air 2018. State of Global Air 2018.

Pollution 218