This site uses cookies to improve your experience. To help us insure we adhere to various privacy regulations, please select your country/region of residence. If you do not select a country, we will assume you are from the United States. Select your Cookie Settings or view our Privacy Policy and Terms of Use.
Cookie Settings
Cookies and similar technologies are used on this website for proper function of the website, for tracking performance analytics and for marketing purposes. We and some of our third-party providers may use cookie data for various purposes. Please review the cookie settings below and choose your preference.
Used for the proper function of the website
Used for monitoring website traffic and interactions
Cookie Settings
Cookies and similar technologies are used on this website for proper function of the website, for tracking performance analytics and for marketing purposes. We and some of our third-party providers may use cookie data for various purposes. Please review the cookie settings below and choose your preference.
Strictly Necessary: Used for the proper function of the website
Performance/Analytics: Used for monitoring website traffic and interactions
In August 2012, coal produced 39% of US electricity, up from a low of 32% in April 2012, when the natural gas share of generation equaled that of coal. The August coal share of generation is still notably lower than the 50% annual average over the 1990-2010 period. Data for 2011 and 2012 are preliminary.
A multi-Hubbert analysis of coal production by Tadeusz Patzek at The University of Texas at Austin and Gregory Croft at the University of California, Berkeley concludes that the global peak of coal production from existing coalfields will occur close to the year 2011. The CO 2 emissions from burning this coal will also decline by 50%.
World energy consumption by fuel type, 2010-2040. The US Energy Information Administration’s (EIA’s) International Energy Outlook 2013 (IEO2013) projects that world energy consumption will grow by 56% between 2010 and 2040, from 524 quadrillion British thermal units (Btu) to 820 quadrillion Btu. Source: IEO2013.
Preliminary electric power data show that, for the first time since the US Energy Information Administration (EIA) began collecting the data, electricity generation from natural gas-fired plants is virtually equal to generation from coal-fired plants, with each fuel providing 32% of total generation. Source: EIA.
With the exception of 2010, emissions have declined every year since 2007. The largest drop in emissions in 2012 came from coal, which is used almost exclusively for electricity generation. Even a modest jump in gas prices could erase this advantage.
South Africa state-owned power utility Eskom reports that a design study is currently under way for an underground coal gasification (UCG) demonstration plant, which will include a 250,000 Nm 3 /h gas production plant and a 100 MW to 140 MW gas turbine plant. The coal seam lies between 280 m and 300 m deep.
Exxon Mobil Corporation’s new The Outlook for Energy: A View to 2040 , released last week, projects that global energy demand in 2040 will be about 30% higher than it was in 2010 as population grows to 9 billion and global GDP doubles. By 2040, heavy duty fuel demand will be up about 60 percent versus 2010. billion units.
Life-cycle GHG emissions from fossil and alternative sources of electricity. This global climate change problem becomes manageable only if society deals quickly with emissions of carbon dioxide from burning coal in electric power plants, they state. Credit: ACS, Kharecha et al. Click to enlarge. Kharecha et al. Kharecha et al.
Consumption-based power mixes and NG transmission distances by Chinese province in 2010. In regions where the share of coal-based electricity is relatively low, EVs can achieve substantial GHG reduction, the team reports in a paper in the ACS journal Environmental Science & Technology. Credit: ACS, Huo et al. Click to enlarge.
Comparison of coal consumption and CO 2 emissions for co-production and separate production of liquids and power. Conventional CTL plant gasifies coal to produce a syngas which is then converted in a Fischer-Tropsch reactor to products. GHGT-10 took place 9-23 September 2010 in RAI, Amsterdam, The Netherlands.
Australia’s Syngas Limited has engaged Rentech to provide Fischer-Tropsch fuels production preliminary engineering services for Syngas’ proposed commercial scale coal and biomass to liquids (CBTL) fuels facility in Southern Australia, known as the Clinton Project. Gas Conditioning. Additionally, the Clinton coal fluidizes well.
Australia-based underground coal gasification (UCG) company Linc Energy ( earlier post ) has signed an exclusive agreement with the UK-based alkaline fuel cell technology company AFC Energy Plc and its related company, B9 Coal ( earlier post ). Linc Energy anticipates commencing testing of the system at Chinchilla by mid April 2010.
Energy-related CO 2 emissions buy state, 2010. The US Energy Information Administration (EIA) has released a new report, State-Level Energy-Related Carbon Dioxide Emissions, 2000-2010. Topping the list for absolute emissions in 2010 was Texas (652.6 2010 state energy-related CO 2 emissions for transportation sector.
Syngas Limited has raised A$530,000 (US$532,000) via a share placement to contribute toward the continued development of the proposed coal-and-biomass-to-liquids Clinton Project in South Australia. Coal is the primary feedstock, supplemented with non-food biomass to reduce carbon emissions. First production is targeted for mid-2015.
has been chosen to provide the coal gasification technology for the Taylorville Energy Center (TEC), a 730-megawatt (gross) advanced coal generating plant being developed near Taylorville, Ill. TEC will be one of the first commercial-scale, coal gasification plants with carbon capture and storage (CCS) capability in the US. .
Total subsidies for renewable energy stood at $66 billion in 2010 (a 10% increase from the year before); the total value of global fossil fuel subsidies is estimated at between $775 billion and more than $1 trillion in 2012, Two thirds of the renewable energy subsidies went to renewable electricity resources and the remaining third to biofuels.
The decrease was driven by the economic downturn, combined with a significant switch from coal to natural gas as a source of electricity generation, according to the EIA. CO 2 emissions from petroleum in 2010 are projected to increase by 0.6%, which is lower than the 1.5% decline in coal-based CO 2 emissions for 2009.
The United States used significantly less coal and petroleum in 2009 than in 2008, and significantly more wind power. There also was a decline in natural gas use and increases in solar, hydro and geothermal power according to the most recent energy flow charts released by the Lawrence Livermore National Laboratory. 22,09, 2.16
billion) in total, Alstom has signed a power plant contract worth the equivalent of more than €650 million (US$923 million) with Tenaga Janamanjung Sdn Bhd to provide key power generation equipment to South East Asia’s first 1000 MW supercritical coal-fired power plant Manjung, Malaysia. In a project worth about €1 billion (US$1.4
announced the commitment of funds to launch a US$1-billion underground coal gasification gas-to-liquids (UCG-GTL) project in Mongolia. The project will transform low-quality deeply-embedded, underground coal into synthetic diesel. km) over the largest Mongolian Shivee-Ovoo brown coal deposit. Google Maps. mi, 774 sq.
Ignite Energy Resources (IER), developer of a supercritical water technology, and TRUenergy have entered into a Memorandum of Understanding (MoU) to develop a commercial demonstration plant that will apply IER’s direct coal-to-oil and upgraded dry coal process to the brown coal at TRUenergy’s Yallourn mine in Australia.
The US Environmental Protection Agency (EPA) released its third year of greenhouse gas data detailing greenhouse gas emissions and trends broken down by industrial sector, greenhouse gas, geographic region, and individual facility. Fossil-fuel fired power plants remain the largest source of US greenhouse gas emissions.
The TCEP would integrate coal gasification, combined-cycle power generation, CO 2 capture, and. We now have sales commitments in place for all three of TCEP’s main commercial products—electric power, urea for fertilizer, and CO 2 for enhanced oil recovery—and that is obviously key to getting this project underway.
On Saturday, Israel’s Ministry of Energy & Water Resources reported that commercial natural gas production had begun from the deepwater Tamar field (c. Tamar was the world’s largest natural gas discovery in 2009, notes Delek Energy, one of the Tamar partners. Israel natural gas demand forecast 2011-2040. Source: Noble Energy.
trillion in 2010) would be required to overcome poverty; increase food production to eradicate hunger without degrading land and water resources; and avert the climate change catastrophe. These trends, which are diametrically opposed to declared greenhouse gas mitigation goals and targets, are by no means limited to emerging economies.
Comparative levelized cost of electricity in 2025 ($/MWh) at different CO 2 prices. Representative costs are reported in constant December 2010 US dollars. impacts on existing generating plants from pending or anticipated environmental rules on emissions, use of water resources, and coal ash handling and disposal. Source: EPRI.
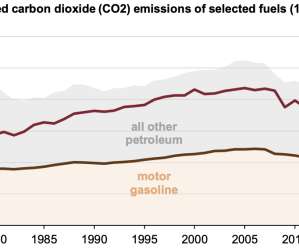
The increase in 2018 was largely caused by increased energy use as a result of weather and was the largest increase in CO 2 emissions since 2010, when the US economy was recovering from an economic recession. The United States now emits less CO 2 from coal than from motor gasoline. Total net electricity generation fell by 1.5%
By 2040, hybrids are expected to account for about 35% of the global light-duty vehicle fleet, up from less than 1% in 2010. The growth reflects an expected 90% increase in electricity use, led by developing countries where 1.3 billion people are currently without access to electricity. liters per 100 km) in 2010.
A detailed study by researchers from China and the US has concluded that Fischer-Tropsch synthetic liquid fuels (FTL) are typically less costly to produce when electricity is generated as a major coproduct than when the plants are designed to produce mainly liquid fuels. published in the ACS journal Energy & Fuels. Guangjian Liu, Eric D.
Assuming no new policies, growth in energy-related CO 2 is driven by electricity and transportation fuel use. The full AEO2010 report, including projections with differing assumptions on the price of oil, the rate of economic growth, and the characteristics of new technologies, will be released in early 2010, along with regional projections.
This year’s outlook is the first to highlight the significant impact that falling battery costs will have on the electricity mix over the coming decades. BNEF predicts that lithium-ion battery prices, already down by nearly 80% per megawatt-hour since 2010, will continue to tumble as electric vehicle manufacturing builds up through the 2020s.
As the world population increases by the estimated 30% from 2010 to 2040, ExxonMobil sees global GDP rising by about 140%, but energy demand by only about 35% due to greater efficiency. Across OECD nations, the Outlook assumes the implied cost of policies to reduce greenhouse gas emissions will reach about $80 per tonne in 2040.
EIA’s AEO2012 projects a continued decline in US imports of liquid fuels due to increased production of gas liquids and biofuels and greater fuel efficiency. Net petroleum imports as a share of total US liquid fuels consumed drop from 49% in 2010 to 38% in 2020 and 36% in 2035 in AEO2012. million barrels per day in 2010.
Electric vehicles charged in coal-heavy regions can create more human health and environmental damages from life cycle air emissions than gasoline vehicles, according to a new consequential life cycle analysis by researchers from Carnegie Mellon University.
Australia-based Carbon Energy Limited is in the final stages of constructing its 5 MW power station which will be powered by syngas produced from its underground coal gasification (UCG) facility at Bloodwood Creek in Queensland. This is an Australian first for fuelling this type of power station with syngas. Carbon Energy UCG design.
The US Energy Information Administration (EIA) reported that after an increase in 2010 of 3.3%, energy-related carbon dioxide emissions in the US in 2011 decreased by 2.4% (136 million metric tons), while GDP grew by 1.8%. In 2010, the price of regular gasoline averaged $2.78 mpg) from 2010 to 2011. per gallon.
According to the US Energy Information Administration (EIA), US electricity generation in 2010 was 70% fossil fuels (coal 44.9%, natural gas 23.8%); 20% nuclear; and 10% renewable, of which 6.2% EIA forecasts that the mix in 2035 will shift to include 39% coal; 27% natural gas; and 16% renewables.
These diagrams depict energy use and water flow during the year 2010, the latest year for which comprehensive data is available. Some water resources also flow up to energy resources (petroleum, biomass, natural gas, and coal). coal, natural gas, geothermal and nuclear) into electricity.
Dominion Energy announced a significant expansion of the company's greenhouse gas emissions-reduction goals, establishing a new commitment to achieve net zero emissions by 2050. The goal covers carbon dioxide and methane emissions, the dominant greenhouse gases, from both electricity generation and gas infrastructure operations.
The American Power Act, released as a discussion draft, targets reducing greenhouse gas (GHG) emissions by at least 4.75% compared to 2005 levels by 2013; by at least 17% compared to 2005 levels by 2020; by at least 42% compared to 2005 levels by 2030; and by at least 83% compared to 2005 levels by 2050. Natural Gas.
Natural gas emerged as the fuel of choice, posting the biggest gains and accounting for 45% of the rise in energy consumption. Gas demand growth was especially strong in the United States and China. Still, that was not fast enough to meet higher electricity demand around the world that also drove up coal use.
Environment Canada released the text of the proposed regulations to reduce emissions from the coal-fired electricity sector. The proposed Regulations will apply a performance standard to new coal-fired electricity generation units and those coal-fired units that have reached the end of their economic life.
Patterned portions represent GHG emissions associated with electric propulsion. Solid left bar = hydro electricity scenario.) A new study by researchers at the University of Toronto examines the impact of the interaction between driving patterns (distance and conditions) and the mode of electricity generation (e.g.,
Since 1990, however, the ESCII (2010 = 100) has remained essentially static, changing by less than 1%. tCO 2 /toe); in 2010 it was 56.7 The IEA said that this reflects the continued domination of fossil fuels—particularly coal—in the energy mix and the slow uptake of other, lower-carbon supply technologies.
We organize all of the trending information in your field so you don't have to. Join 5,000+ users and stay up to date on the latest articles your peers are reading.
You know about us, now we want to get to know you!
Let's personalize your content
Let's get even more personalized
We recognize your account from another site in our network, please click 'Send Email' below to continue with verifying your account and setting a password.


Let's personalize your content