This site uses cookies to improve your experience. To help us insure we adhere to various privacy regulations, please select your country/region of residence. If you do not select a country, we will assume you are from the United States. Select your Cookie Settings or view our Privacy Policy and Terms of Use.
Cookie Settings
Cookies and similar technologies are used on this website for proper function of the website, for tracking performance analytics and for marketing purposes. We and some of our third-party providers may use cookie data for various purposes. Please review the cookie settings below and choose your preference.
Used for the proper function of the website
Used for monitoring website traffic and interactions
Cookie Settings
Cookies and similar technologies are used on this website for proper function of the website, for tracking performance analytics and for marketing purposes. We and some of our third-party providers may use cookie data for various purposes. Please review the cookie settings below and choose your preference.
Strictly Necessary: Used for the proper function of the website
Performance/Analytics: Used for monitoring website traffic and interactions
New analysis has found increasing emissions of several ozone-depleting chemicals despite their production being banned for most uses under the Montreal Protocol—and a loophole in the rules is likely responsible. According to the researchers, emissions from these CFCs currently do not significantly threaten ozone recovery.
Illustration of projected ozone changes in the South Coast region due to climate change in 2050. Areas in orange and red could see ozone concentrations elevated by 9 to 18 parts per billion. We already know that climate change will bring us increased forest fires, shorter winters, hotter summers and impact our water supply.
A study by a team of researchers from China, the US and Germany suggests that future climate change may worsen air quality for more than 85% of China’s population, leading to an additional 20,000 deaths each year. and ozone exposure, respectively. and ozone exposure, respectively. C) and ozone (D) exposure are shown.
Ozone levels across much of North America and Europe dropped significantly between 2000 and 2014. People living in parts of southern Europe, South Korea and southern Japan and China also experienced more than 15 days a year of ozone levels above 70 ppb. Trends in daily maximum ozone levels (known as 4MDA8) at urban and non-urban sites.
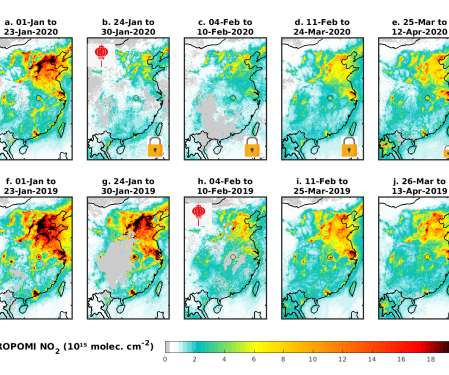
Levels of two major air pollutants have been reduced significantly since lockdowns began in response to the COVID-19 pandemic, but a secondary pollutant—ground-level ozone—has increased in China, according to new research. Ozone is harmful to humans at ground-level, causing pulmonary and heart disease. —Guy Brasseur.
The decrease in CO 2 equivalent emissions of ODSs (ozone-depleting substances: CFCs, halons, HCFCs, and others) may be offset by the projected increase in their non-ozone depleting substitutes (HFCs) (lines designated as HFC scenarios). The contribution of HFCs to climate forcing is currently less than 1% of all greenhouse gases.
Extraordinarily cold temperatures in the stratosphere during the winter of 2010/2011 caused the most massive destruction of the ozone layer above the Arctic so far, according to a study by climate researchers at KIT (Karlsruhe Institute of Technology). Their paper appears in the journal Geophysical Research Letters.
US EPA Region 9 8-hour ozone trends, 1979-2000. These State Implementation Plans (SIPs) are the roadmaps to meeting the 1997 8-hour ozone National Ambient Air Quality Standards (NAAQS) of 0.08 In 1997, EPA first established the 8-hour ozone standard, which replaced the older 1-hour ozone standard (0.12 Source: EPA.
Increasing urban albedo is something that should be done now to buy time for implementing other near-term and long-term climate mitigation strategies. Surabi Menon, Hashem Akbari, Sarith Mahanama, Igor Sednev and Ronnen Levinson (2010) Radiative forcing and temperature response to changes in urban albedos and associated CO 2 offsets.
In a new study published online 10 March in the ACS journal Environmental Science and Technology , however, Stanford University professor Mark Jacobson finds that local CO 2 emissions in isolation may increase local ozone and particulate matter. Jacobson, 2010. Jacobson (2010) Enhancement of Local Air Pollution by Urban CO 2 Domes.
Schematic diagram of the trade-offs between the implications for regional air quality and global climate change of new policies for management of the atmosphere. The project builds upon the idea that air quality and climate change issues are linked through “one atmosphere”, an approach that demands coordination and multi-tiered approaches.
NOAA’s updated Annual Greenhouse Gas Index (AGGI), which measures the direct climate influence of many greenhouse gases such as carbon dioxide and methane, shows a continued steady upward trend. in 2010—i.e., Started in 2004, the AGGI reached 1.29 This is slightly higher than the 2009 AGGI, which was 1.27—i.e., —i.e.,
The amount of greenhouse gases in the atmosphere reached a new high in 2010 since pre-industrial time and the rate of increase has accelerated, according to the World Meteorological Organization’s (WMO) Greenhouse Gas Bulletin. Between 2009 and 2010, its atmospheric abundance increased by 2.3 parts per million) and the past decade (2.0
Compared to the 2010 “Business as Usual” scenario—which includes all adopted emission control measures for the South Coast—NO x levels must be reduced by 65% and by 75% to meet the 2023 and 2032 ozone standards, respectively. California’s Climate Protection Strategies do not help meet NAAQS Standards.
Climate response to non-CO 2 vehicle emissions. Global and regional zonal mean temperature changes relative to 2010 due to non-CO 2. Bars on the right show uncertainty ranges for 2070, including contributions from both forcing and climate sensitivity (67%; CI). Shindell et al. Click to enlarge. Shindell et al. Click to enlarge.
A new study by led by Nadine Unger at NASA’s Goddard Institute for Space Studies (GISS) that analyzes the net climate impacts of emissions from economic sectors rather than by individual chemical species has found that on-road transportatation is and will be the greatest net contributor to atmospheric warming now and in the near term.
Lisa P Jackson, Administrator of the US Environmental Protection Agency, issued a public memo to EPA employees detaling “ seven key themes to focus the work of our agency ” in 2010 and beyond. The seven themes are: Taking Action on Climate Change. Improving Air Quality.
Biogas produced from manure, waste from food industries, and organic household waste were found to provide a climate benefit of 148%, 119% and 103%, respectively, compared to fossil fuels. Pål Börjesson, Linda Tufvesson & Mikael Lantz (2010) Livscykelanalys av svenska biodrivmedel (Swedish with English abstract and summary).
The UN Intergovernmental Panel on Climate Change (IPCC) released a policymaker’s summary of Working Group III’s (WG III) latest report showing that despite a growing number of climate change mitigation policies, annual anthropogenic GHG emissions grew on average by 1.0 GtCO 2 eq/yr in 2010. Transport sector.
The studies use case studies to demonstrate the co-benefits of tackling climate change in four sectors: electricity generation, household energy use, transportation, and food and agriculture. Climate change threatens us all, but its impact will likely be greatest on the poorest communities in every country.
A new study comparing both the absolute and normalized climate impacts of current passenger and freight transportation finds that driving a car increases global temperatures in the long run more than making the same long-distance journey by air.
The team used a population-weighted multi pollutant index (PW-MPI), suited for global model output, with the atmospheric chemistry general circulation model EMAC to estimate the impact of anthropogenic emission changes on global and regional air quality in recent and future years (2005, 2010, 2025 and 2050).
This would have been a big win for climate. That the reduction has not materialized—and that global emissions have instead risen—is a puzzle, and may have implications for the Montreal Protocol, the international treaty that was designed to protect the stratospheric ozone layer. —co-author Dr Matt Rigby.
That’s three times the amount estimated by the Intergovernmental Panel on Climate Change (IPCC). Nitrous oxide is a potent greenhouse gas that contributes to climate change and stratospheric ozone destruction. 2010) Nitrous oxide emission from denitrification in stream and river networks. Beaulieu et al.
The figure includes the direct effects and those indirect effects due to the production of tropospheric ozone and stratospheric water vapor.) Overall, EPA reported a slightly less than 1% drop in methane (CH 4 ) emissions from 2010 to 2011 (from 592.7 12.6%) decrease under 2010 emission levels. a global warming potential of 21.
Ethane reacts with sunlight and other molecules in the atmosphere to form ozone, which at the surface can cause respiratory problems, eye irritation and other ailments and damage crops. A snapshot from a simulation of how Bakken oil field hydrocarbon emissions including ethane affect North American ground-level ozone concentrations.
C) greater than the 1981-2010 baseline period. In 2006, NOAA’s Climate Program Office introduced the State of the Arctic Report which established a baseline of conditions at the beginning of the 21 st century. Sea ice: Minimum Arctic sea ice area in September 2011 was the second lowest recorded by satellite since 1979.
Funding priorities through the ARFVT Program support fuel and vehicle development to help attain the state’s climate change policies. million ZEVs on the state’s roads.
The design of the California cap-and-trade program allows linkage with programs established by partner jurisdictions in the Western Climate Initiative (WCI) to create a regional market system. Cap and Trade 2010. Tags: Climate Change Emissions Fuels Policy. Sector-Based Offset Credits. ARB Emissions Trading Program Overview.
Life cycle inventories have typically been presented at global, national, or regional levels—sufficient for understanding global processes such as climate change and fossil fuel depletion, but insufficient for the analysis of local processes such as air pollution, according to the researchers.
Organic aerosol (OA) in the atmosphere is detrimental to human health and represents a highly uncertain forcing of climate change. The use of petroleum-derived fuels is an important source of reactive gas-phase organic carbon that provides key precursors to the formation of secondary OA (SOA) and tropospheric ozone. Earlier post.).
A NASA-led study has documented an unprecedented depletion of Earth’s protective ozone layer above the Arctic last winter and spring caused by an unusually prolonged period of extremely low temperatures in the stratosphere. The same ozone-loss processes occur each winter in the Arctic.
while the US GDP is projected to grow by 40%, according to the fifth National Communication on US climate change actions submitted by the US Department of State to the United Nations Framework Convention on Climate Change. The United States released previous Climate Action Reports in 1994, 1997, 2002, and 2006. 5,813 Tg CO 2 Eq.
Global benefits from full implementation of measures for reduction of short-lived climate pollutants in 2030 compared to the reference scenario. The climate change benefit is estimated for a given year (2050) and human health and crop benefits are. for 2030 and beyond. Source: UNEP. Click to enlarge. Earlier post.).
This could explain satellite measurements showing high levels of stratospheric ozone, water vapor and other chemicals over Asia during summer. When sulfur rises into the stratosphere, it can lead to the creation of small particles called aerosols that are known to influence the ozone layer. Science doi: 10.1126/science.1182274.
HFCs are chemicals are potential substitutes for ozone-depleting and climate-warming CFCs and HCFCs currently being phased out under the Montreal Protocol treaty to protect the ozone layer. The Joint Task Force will submit its report by 1 August 2011. The United States, Mexico, and Canada also proposed a similar amendment.
The update identifies eight key sectors for ongoing action: Energy; Transportation, fuels, land use and infrastructure; Agriculture; Water; Waste management; Natural lands; Short-Lived Climate Pollutants (such as methane and black carbon); and Green Buildings. In 2014, ARB will propose enhancements to strengthen the LCFS.
We organize all of the trending information in your field so you don't have to. Join 5,000+ users and stay up to date on the latest articles your peers are reading.
You know about us, now we want to get to know you!
Let's personalize your content
Let's get even more personalized
We recognize your account from another site in our network, please click 'Send Email' below to continue with verifying your account and setting a password.


Let's personalize your content