Remove 2005 Remove Coal Remove Gas-Electric Remove Light
article thumbnail

EPA GHG Inventory shows US GHG down 1.7% y-o-y in 2019, down 13% from 2005

Green Car Congress

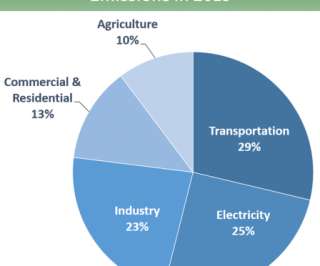
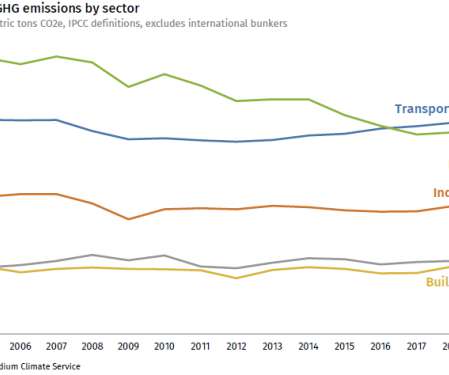
The US Environmental Protection Agency (EPA) released its 28 th annual Inventory of US Greenhouse Gas Emissions and Sinks (GHG Inventory), which presents a national-level overview of annual greenhouse gas emissions from 1990 to 2019. The number of vehicle miles traveled (VMT) by light-duty vehicles (i.e., from 2018 to 2019.

2005 418
article thumbnail

Rhodium Group estimates US GHG fell 2.1% in 2019, driven by coal decline

Green Car Congress

The Rhodium Group, an independent research provider, estimates that, after a sharp uptick in 2018, US greenhouse gas (GHG) emissions fell by 2.1% This decline was due almost entirely to a drop in coal consumption. Coal-fired power generation fell by a record 18% year-on-year to its lowest level since 1975. Coal-driven decline.

Coal 370
article thumbnail

Canada targets cutting GHGs 30% below 2005 levels by 2030; new regulations for oil and gas, power, petrochemicals

Green Car Congress

Canada Environment Minister Leona Aglukkaq announced that Canada plans to reduce its greenhouse gas (GHG) emissions by 30% below 2005 levels by 2030. The new regulations include: Regulations aligned with recently proposed actions in the United States to reduce GHG methane from the oil-and-gas sector. over the same time period.

2005 150
article thumbnail

EPA: US greenhouse gases dropped 3.4% in 2012 from 2011; down 10% from 2005 levels

Green Car Congress

US greenhouse gas emissions by gas. The US Environmental Protection Agency (EPA) released its 19 th annual report of overall US greenhouse gas (GHG) emissions, showing a 3.4% Annual US greenhouse gas emissions relative to 1990 (1990=0). Source: EPA. Click to enlarge. decrease in 2012 from 2011. The Inventory of U.S.

2005 252
article thumbnail

EPA: US GHG fell 0.5% y-o-y in 2017; power sector down by 4.2%, transportation up 1.21%

Green Car Congress

Year-over-year, US greenhouse gas emissions were 0.5% lower in 2017 than the prior year (after accounting for sequestration from the land sector), and power sector emissions fell 4.2%, according to the 2019 edition of the US Environmental Protection Agency’s (EPA) annual report on greenhouse gas (GHG) emissions.

2017 199
article thumbnail

EPA: US GHG emissions in 2017 down 0.3% from 2016

Green Car Congress

greenhouse gas emissions were 6,472.3 from 2016, according to the US Environmental Protection Agency’s (EPA’s) latest Greenhouse Gas Inventory. The decrease in total greenhouse gas emissions between 2016 and 2017 was driven in part by a decrease in CO 2 emissions from fossil fuel combustion. below 2005 levels.

2017 262
article thumbnail

EPA: US greenhouse gases up 2% in 2013; increased coal consumption, cool winter

Green Car Congress

over the prior year, according to the EPA’s newly published Inventory of US Greenhouse Gas Emissions and Sinks: 1990–2013. By sector, power plants were the largest source of emissions, accounting for 31% of total US greenhouse gas pollution. CO 2 emissions from passenger cars and light-duty trucks peaked at 1,181.2 MMT CO 2 Eq.)

2013 150