This site uses cookies to improve your experience. To help us insure we adhere to various privacy regulations, please select your country/region of residence. If you do not select a country, we will assume you are from the United States. Select your Cookie Settings or view our Privacy Policy and Terms of Use.
Cookie Settings
Cookies and similar technologies are used on this website for proper function of the website, for tracking performance analytics and for marketing purposes. We and some of our third-party providers may use cookie data for various purposes. Please review the cookie settings below and choose your preference.
Used for the proper function of the website
Used for monitoring website traffic and interactions
Cookie Settings
Cookies and similar technologies are used on this website for proper function of the website, for tracking performance analytics and for marketing purposes. We and some of our third-party providers may use cookie data for various purposes. Please review the cookie settings below and choose your preference.
Strictly Necessary: Used for the proper function of the website
Performance/Analytics: Used for monitoring website traffic and interactions
Significant climate anomalies 2008/2009. Source: ClimateChange Compendium. Shifts in the hydrological cycle resulting in the disappearance of regional climates with related losses of ecosystems, species and the spread of drylands northwards and southwards away from the equator. Click to enlarge. Earlier post.).
Illustration of projected ozone changes in the South Coast region due to climatechange in 2050. The study also predicts that peak concentrations of dangerous airborne particles will increase in the San Joaquin Valley due to the effects of climatechange on wind patterns. Click to enlarge. Nichols, ARB chairman.
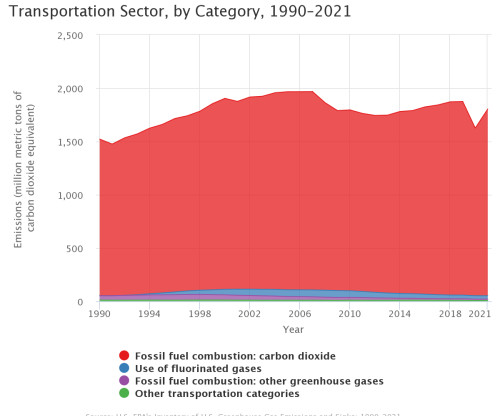
The California Air Resources Board (CARB) announced that greenhouse gas emissions in California in 2016 fell below 1990 levels for the first time since emissions peaked in 2004—a reduction roughly equivalent to taking 12 million cars off the road or saving 6 billion gallons of gasoline a year. How the inventory is compiled.
The decline in new light-duty vehicle fuel economy between 1990 and 2004 reflected the increasing market share of light-duty trucks, which grew from about 29.6% This report has been compiled annually since 1993 and submitted to the United Nations Framework Convention on ClimateChange. of new vehicle sales in 1990 to 48.0%
Before this study, we didn’t know how fast that carbon could potentially be released from permafrost, and how this feedback to climate would change over time. An understanding of the rate of carbon release is necessary to estimate the strength of positive feedback to climatechange, a likely consequence of permafrost thaw.
Since carbon dioxide emissions are highly correlated with fuel consumption (FC), fuel consumption regulation is a useful policy instrument to combat climatechange. —Dror et al.
Since then, LTD hired a Sustainability Program Manager and conducted carbon footprint analysis of its operations to measure the impacts and benefits of public transit on climatechange. Since 2004, NFI has delivered 50 buses to LTD, including New Flyer transit buses and low-floor cutaway buses from NFI sister company ARBOC.
Achates Power, the developer of next-generation two-stroke compression-ignition opposed-piston (OP) engines ( earlier post ) announced that OGCI Climate Investments has invested in the company’s Series-D round. —Dr Pratima Rangarajan, CEO of OGCI Climate Investments.
The on-road transportation (ORT) and power generation (PG) sectors are major contributors to CO 2 emissions and a host of short-lived radiatively-active air pollutants, including tropospheric ozone and fine aerosol particles, that exert complex influences on global climate. database) from another global inventory for the year 1996.
It found that trade among developing nations—South-South trade—more than doubled between 2004 and 2011. —Dabo Guan, professor in climatechange economics at UEA’s School of International Development and co-author on both studies. Gt in 2004 and 2.2 Gt in 2004 to 1.1 —Prof Guan.
The change in runoff inferred from streamflow records worldwide between 1948 and 2004, with bluish colors indicating more streamflow and reddish colors less. Graphic courtesy Journal of Climate, modified by UCAR.) The results will be published 15 May in the American Meteorological Society’s Journal of Climate.
Greenhouse Gas Emissions and Sinks , which is submitted annually to the Secretariat of the United Nations Framework Convention on ClimateChange, presents a national-level overview of annual greenhouse gas emissions since 1990. in 2004, and since then have declined about 10%. ClimateChange Emissions' Tg CO 2 Eq.
X PRIZE’s Energy & Environment Prize Group intends to catalyze a new era of clean, renewable, cost-effective energy with minimal impact on the climate and environment. Areas of consideration include breakthroughs in climatechange, water resource management, energy distribution & storage, clean energy, energy efficiency/use.
The report’s authors, Max von Bismarck and Anuradha Gurung from the World Economic Forum, and Chris Greenwood and Michael Liebreich from New Energy Finance, argue that “ enormous investment in energy infrastructure is required to address the twin threats of energy insecurity and climatechange. billion) in 2004.
EPA’s SmartWay Transport Partnership is a market-driven initiative that empowers businesses to move goods in the cleanest, most energy-efficient way possible to protect public health and reduce the emissions that contribute to climatechange.
The findings, published in the 21 September issue of Atmospheric Chemistry and Physics , are generally consistent with official Chinese government statistics and could bolster their credibility as international negotiations proceed on commitments of China and other nations to combat climatechange. Munger, J. McElroy, M. Nielsen, C.
This year’s Greenhouse Gas Bulletin is the fifth in the series, reporting data since 2004. Tags: ClimateChange Emissions. These two classes of compounds are very potent greenhouse gases and together with sulphur hexafluoride (SF 6 ) they contributed 8.9% WMO Greenhouse Gas Bulletin (no.
Our relationship started about a month ago when we spent an evening together carpooling to a UCLA workshop on communication climatechange that we both participated in. Public Policy Conference on Clean Air - 2004. Earth - Environment - Economic - Election - 2004. ClimateChange: The State of Current Knowledge - 2005.
In both cases, the NO x emissions were surprisingly low and 99% cleaner than the current standard and 99.96% cleaner than the 2004 standard. Pursuing RNG technology is a promising and visionary pathway for California and is recommended by UCR’s RNG research center.
Satellite records from 2004 to 2009 showed a pattern of increases in the chemical’s presence in the stratosphere each summer, correlating with the timing of the monsoon. When sulfur rises into the stratosphere, it can lead to the creation of small particles called aerosols that are known to influence the ozone layer. William Randel.
The “Trends and Projections in Europe” package includes an assessment of progress towards the EU’s climate targets, preliminary EU greenhouse gas emissions estimates for 2017, a specific analysis of trends and projections in the EU Emissions Trading System (ETS) and briefing summarizing the recent GHG trends and projections in Europe.
Since MY 2004, CO 2 emissions have decreased 23%, or 108 g/mi, and fuel economy has increased 30%, or 5.8 Other highlights from the report include: Since model year 2004, technology has been used to increase fuel economy (up 30%) and power (up 14%), while maintaining vehicle weight and reducing CO 2 emissions.
MMT CO 2 ) from 1990 due, in large part, to increased demand for travel as fleet-wide light-duty vehicle fuel economy was relatively stable (average new vehicle fuel economy declined slowly from 1990 through 2004 and then increased more rapidly from 2005 through 2013). MMT CO 2 in 2004, and since then have declined about 13%.
Key findings of the study include: Average soybean yield for the 2004-2007 time period was 42.35 Key findings of the study include: Average soybean yield for the 2004-2007 time period was 42.35 Reviewers included Dr. Martin Patel of Utrecht University and Michael Levy of the American Chemistry Council. kg (for the 3.36 kg (for the 3.36
The ocean absorbs CO 2 from the atmosphere at a rate of more than 20 million tons per day, thus removing one-fourth of the anthropogenic CO 2 emitted to the atmosphere each year and reducing the climate-change impacts of this greenhouse gas. However, when CO 2 dissolves in seawater, it forms carbonic acid. Monaco Declaration.
ICESat measurements of winter multi-year ice cover in the Arctic Ocean between 2004 and 2008, along with the corresponding downward trend in overall winter sea ice volume, and switch in dominant ice type from multi-year ice to first-year ice. These are dramatic changes. Tags: ClimateChange Polar. Click to enlarge.
World-wide “peak oil” production is expected to occur from 2010 to 2025+ (by some experts estimate that we have already reached peak production since 2004). Tags: ClimateChange Emissions Fuels. The US Department of Defense (DoD) is the single largest buyer and consumer of fuel at 12.6 Dorner et al.
Black carbon is a key short-lived climatechange forcer ( earlier post ) and motor vehicles are important sources of BC in the environment. 2004) A technology-based global inventory of black and organic carbon emissions from combustion. An earlier global BC emission inventory by Bond et al. Streets, D. Yarber, K. Nelson, S.
But in a year that has seen both a worsening recession and state budget crisis, residents’ support for urgent action on climatechange has slipped and a partisan divide on the issue has widened. But in the current economic climate their support has dropped a notch. Mark Baldassare, president and CEO of PPIC.
This project was terminated in 2004 due to cost overruns and opposition on environmental grounds. Tags: ClimateChange Emissions Lifecycle analysis Oil Shale. More recently, OSEC has proposed using the Petrosix process, another oil shale retorting technology. Energy Fuels , Article ASAP doi: 10.1021/ef900678d.
The declining increase in China’s emissions fits the trend since 2004, when its emissions increased by 17%. These changes reflect the large economic development in China, structural changes in national and global economies, and the impact of climate and energy policies. Tags: ClimateChange Emissions.
megatonnes of CO 2 eq in 2004, 35.8 Bitumen and Biocarbon: Land use changes and loss of biological carbon due to bitumen operations in the boreal forests of Alberta, Canada. Tags: ClimateChange Emissions Lifecycle analysis Oil sands. megatonnes. The bituminous sands industry reported emissions of 28.5
The EDGAR database shows that greenhouse gas emissions have been rising faster in developing countries than in industrialized ones since 2004, even though developing countries emit lower levels of the gases. It also provides data on greenhouse-gas emissions for the 20 years preceding the 1990 Kyoto protocol.
The report, Inventory of US Greenhouse Gas Emissions and Sinks: 1990-2007 , is the latest annual report that the United States has submitted to the Secretariat of the United Nations Framework Convention on ClimateChange. Tg in 2004, and since then have declined about 3%. Tg in 2007, an increase of 21% percent (197.5
By comparison, meeting Japan’s standards for 2004-2015 requires a 1.9% annual increase to 2015; and meeting China’s 2004-2009 target requires a 5.3% Ford recognizes the need for a comprehensive approach to the reduction of greenhouse gas emissions to address climatechange concerns. annual increase. Sue Cischke.
in 2008, continuing a trend of falling industrial sector emissions since 2004. Tags: ClimateChange Emissions. The commercial sector, which includes all non-residential, non-industrial buildings, such as stores, office buildings, schools, hospitals, and government buildings, experienced an emissions increase of 0.5%
EPA’s SmartWay Transport Partnership is a market-driven initiative that empowers businesses to move goods in the cleanest, most energy-efficient way possible, while protecting public health and reducing the impacts of climatechange. Since 2004, SmartWay Partners have saved 144.3 million barrels of oil and $20.6
The average ice extent during September, a standard measurement for climate studies, was 2.07 feet between 2004 and 2008. While Arctic sea ice extent varies from year to year because of changing atmospheric conditions, ice extent has shown a dramatic overall decline over the past 30 years. million square miles (5.36
Between 2004 and 2006, while the emissions of CO 2 from passenger cars declined by 3%, that from LGVs grew by 22%. Tags: ClimateChange Emissions Europe Fleets. The study provides an estimate of sales-weighted new van CO 2 emissions of 207.6 tonnes, and are described as vans.
The research grew out of two coring expeditions sponsored by the Nyanza Project in 2001 and 2004. Climatechange models show a general warming in the region, which, if accurate, would cause even greater warming of the Lake Tanganyika’s surface waters and more stratification in the lake as a whole. —Andrew Cohen.
In September 2004 the California Air Resources Board (ARB) passed regulations to reduce greenhouse gases (GHG) from new passenger vehicles starting in 2009. Tags: ClimateChange Emissions Policy. These regulations were authorized by the 2002 legislation Assembly Bill 1493 (Pavley).
Between 1990 and 2004, average fuel economy among new vehicles sold annually declined, as sales of light-duty trucks increased. The number of vehicle miles traveled (VMT) by light-duty motor vehicles (passenger cars and light-duty trucks) increased by 45.9%
An Atmospheric River originating over the central Pacific on 16 February 2004. The project also resulted in the first physics-based coastal storm modeling system for analyzing severe storm impacts (predicting wave height and coastal erosion) under present-day scenarios and under various climate-change and sea-level-rise scenarios.
In the fall of 2010, California accepted compliance with these federal GHG standards as meeting similar state standards as adopted in 2004, resulting in the first coordinated national program. In April 2010, DOT and EPA established greenhouse gas emission and fuel economy standards for model year 2012-2016 light-duty cars and trucks.
We organize all of the trending information in your field so you don't have to. Join 5,000+ users and stay up to date on the latest articles your peers are reading.
You know about us, now we want to get to know you!
Let's personalize your content
Let's get even more personalized
We recognize your account from another site in our network, please click 'Send Email' below to continue with verifying your account and setting a password.


Let's personalize your content