Remove 2001 Remove Climate Change Remove Pollution
article thumbnail

Latest GHG Inventory shows California remains below 2020 emissions target; much steeper rate of GHG reductions required

Green Car Congress

The data shows a slight increase in overall emissions from the previous year, and a slight decline in emissions from transportation, which is the state’s main source of both GHGs and air pollutants. Per capita GHG emissions in California have dropped from a 2001 peak of 14.0 Source: California Air Resources Board (ARB).

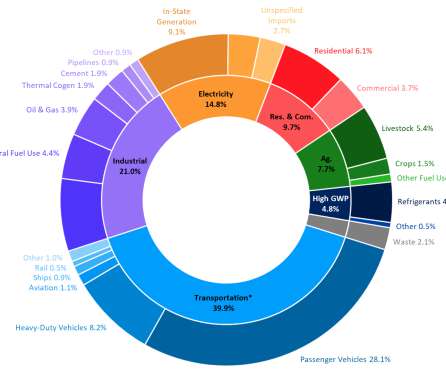
2020 221
article thumbnail

California ARB: GHG emissions fell below 1990 levels for first time in 2016; down 13% from 2004 peak; transportation emissions up 2%

Green Car Congress

The state’s latest Greenhouse Gas Emissions Inventory shows that California emitted 429 million metric tons of climate pollutants in 2016—a drop of 12 million metric tons, or three percent, from 2015. They fell 23% from a peak of 14 metric tons per person (roughly equal to driving 34,000 miles) in 2001 to 10.8

2004 225
article thumbnail

EPA: US greenhouse gases up 2% in 2013; increased coal consumption, cool winter

Green Car Congress

By sector, power plants were the largest source of emissions, accounting for 31% of total US greenhouse gas pollution. billion gallons in 2001 to 1.4 Climate Change Emissions' Industry and manufacturing were the third largest source, at 21%. Transportation sector GHG emissions 1990-2013. Source: EPA. Click to enlarge.

2013 150
article thumbnail

Study Highlights the Importance of Considering Climate Effects of Non-CO2 Emissions from Transport in Mitigation Strategies and Policies

Green Car Congress

The on-road transportation (ORT) and power generation (PG) sectors are major contributors to CO 2 emissions and a host of short-lived radiatively-active air pollutants, including tropospheric ozone and fine aerosol particles, that exert complex influences on global climate. Tags: Climate Change Emissions. Unger et al.

Climate 150
article thumbnail

ICCT: gap between official and real-world fuel economy figures in Europe reaches ~38%; call to implement WLTP ASAP

Green Car Congress

The data show that for private cars, the difference between on-road and official CO 2 values rose from around 8% in 2001 to 31% in 2013. The increasing gap also more than halves the official CO 2 reductions achieved during the last ten years, making it more challenging to meet the EU’s climate change mitigation objectives.

article thumbnail

Driving on sunshine

Plug in America

Finally, I was doing something that could really make a dent in climate change. No pollution, well-to-wheels. “I haven’t paid for electricity for my house or my EV since 2001,” he says. The World Health Organization estimates that some seven million people die every year from polluted air. Hello hope.

Gore 97
article thumbnail

How Remote Sensing Technologies Increase Food Production

Cars That Think

Her dissertation focused on developing methods to determine a baseline for concentrations of pollutants in the atmosphere based on historical spatial-temporal measurements. In 2001 she realized her goal of working on a satellite mission. She earned her Ph.D. She was a Jefferson Science Fellow at the U.S.