This site uses cookies to improve your experience. To help us insure we adhere to various privacy regulations, please select your country/region of residence. If you do not select a country, we will assume you are from the United States. Select your Cookie Settings or view our Privacy Policy and Terms of Use.
Cookie Settings
Cookies and similar technologies are used on this website for proper function of the website, for tracking performance analytics and for marketing purposes. We and some of our third-party providers may use cookie data for various purposes. Please review the cookie settings below and choose your preference.
Used for the proper function of the website
Used for monitoring website traffic and interactions
Cookie Settings
Cookies and similar technologies are used on this website for proper function of the website, for tracking performance analytics and for marketing purposes. We and some of our third-party providers may use cookie data for various purposes. Please review the cookie settings below and choose your preference.
Strictly Necessary: Used for the proper function of the website
Performance/Analytics: Used for monitoring website traffic and interactions
pollution was significantly associated with an increased risk of hospital admissions for several neurological disorders, including Parkinson’s disease, Alzheimer’s disease, and other dementias, in a long-term study of more than 63 million older US adults, led by researchers at Harvard T.H. Chan School of Public Health.
Results from the California Household Travel Survey ( CHTS ) —the largest and most complex review of its kind— show that the%age of California residents walking, biking, or using public transportation on a typical day has more than doubled since 2000. In 2000, that share was only 11%.
The European Community’s air pollutant emission inventory report released by the European Environment Agency finds that in 2007, sulphur oxides (SO x ) emissions were down by 72 % from 1990 levels. EU-27 emissions of all four pollutants were lower in 2007 than in 2006.
The study looked at water quality regulations and found that local officials more heavily enforced regulations on polluting firms that were monitored and tracked by the central government, while not enforcing regulations on firms not tracked. A 10% reduction in pollution led to a 3% drop in productivity for China’s polluting industries.
Researchers from China and the US have found that long-term exposure to air pollution impedes cognitive performance in verbal and math tests. Air quality was measured using the air pollution index (API), which is calculated based on daily readings of sulfur dioxide (SO 2 ), nitrogen dioxide (NO 2 ), and particulate matter smaller than 10 ?m
Long-term exposure to particulate air pollution has been linked to an increased risk of heart disease, but the biological process has not been understood. Participant-specific pollutant concentrations averaged over the years 2000–10 ranged from 9.2–22.6 The study is published in The Lancet. and NO x between 1999 and 2012.
Global sulfur dioxide (SO 2 ) emissions peaked in the early 1970s and decreased until 2000, with an increase in recent years due to increased emissions in China, international shipping, and developing countries in general, according to a new analysis appearing in the open access journal Atmospheric Chemistry and Physics. Credit: Smith et al.
Over one year, it will prevent the release of 2000 tonnes of CO 2 , 42 tonnes of NO x , 2.5 This project demonstrates that today we can replace fossil fuel thermal drives with clean energy, and thus contribute to the fight against global warming and pollution for the well-being of our communities. tonnes of particulates and 1.4
New research by a team from the US, China and Japan focusing on the Houston, Texas area suggests that widespread urban development alters weather patterns in a way that can make it easier for pollutants to accumulate during warm summer weather instead of being blown out to sea. ““The very existence of the Houston area favors stagnation.”
Radiative forcing due to perpetual constant year 2000 emissions grouped by sector for 2020 (left) and 2100 (right) showing the contribution from each species. Cars, buses, and trucks release pollutants and greenhouse gases that promote warming, while emitting few aerosols that counteract it. From Unger et al., Click to enlarge.
Replacing all of the oldest, highly polluting school buses in the US could lead to 1.3 Even relatively short commutes on school buses can dominate students’ daily air pollution exposures. Applying their results nationwide, the researchers extrapolated that replacing all pre-2000 model school buses would lead to more than 1.3
Since 1990, nationwide air quality has improved significantly for the six common air pollutants: ground-level ozone; particle pollution; lead; nitrogen dioxide; carbon monoxide; and sulfur dioxide, according to the US Environmental Protection Agency (EPA) report “Our Nation’s Air - Status and Trends through 2008”. since 2000), by 19%.
Results from a new study by researchers at the University of California Irvine support a growing body of scientific literature indicating that sensitive populations, including children, certain ethnic groups and people of lower socioeconomic status, are more vulnerable to the effects of high exposures to traffic-related air pollution.
A common rail system with a maximum fuel injection pressure of 2000 bar was used as injection system. Optimized fuel properties with regard to different emissions Janssen et al. Click to enlarge. The combustion system reached a specific output of 80 kW/L at maximum peak firing pressures of 220 bar.
This potential leap in destructiveness and pollution—mainly from an increase in wildfire frequency—is forecast by computer models calculating impacts of moderate global warming on western US wildfire patterns and atmospheric chemistry. degrees Celsius (3 degrees Fahrenheit) by 2050. Jennifer Logan. Resources. Spracklen, L. Mickley, J.
With indoor air pollution killing 1.6 If we reduce black carbon emissions worldwide by 50 percent by fully deploying all available emissions-control technologies, we could delay the warming effects of CO 2 by one to two decades and at the same time greatly improve the health of those living in heavily polluted regions. Ramanathan.
Under its pollution prevention treaty (MARPOL), the International Maritime Organization (IMO) adopted mandatory measures to reduce greenhouse gas emissions from international shipping: the Energy Efficiency Design Index (EEDI) and the Ship Energy Efficiency Management Plan (SEEMP). Regulatory background. Background Data.
The US Environmental Protection Agency (EPA) released the Second Integrated Urban Air Toxics Report to Congress—the final of two reports required under the Clean Air Act (CAA) to inform Congress of progress in reducing public health risks from urban air toxics (also referred to as hazardous air pollutants or HAPs).
The California Air Resources Board (CARB) has posted a revised draft of California’s proposed Short-Lived Climate Pollutant (SLCP) Strategy. SLCPs are a category of pollutants which remain in the atmosphere for a relatively brief period, but have global warming potentials that are much higher than those of CO 2.
US EPA Region 9 8-hour ozone trends, 1979-2000. These new SIPs demonstrate that, by 2024, pollution will be reduced to the level needed to attain the 1997 8-hour ozone standard of 0.08 In both areas, statewide measures such as the in-use truck and off-road diesel rules, and smog-check improvements will further reduce air pollution.
For the first time since UCS began the Automaker Rankings report in 2000, all eight major automakers reduced their average greenhouse gas (GHG) and smog-forming emissions compared to their fleet averages from 1998, the model year examined in the first report. Source: UCS. Click to enlarge.
Effects of changes in the average lifespan of ordinary passenger cars newly registered between 1990-2000 on total induced CO 2 emissions in 2000. They also found that extending the lifetime of a vehicle contributed to a moderate increase in emissions of criteria pollutants (NO x , HC, and CO) during the use phase of the vehicle.
This marks Canada’s first regulation of air pollutant emissions from locomotives. The United States started regulating CAC emissions from locomotives in 2000. The Government of Canada has published proposed Locomotive Emissions Regulations in the Canada Gazette, Part I. These regulations were updated in 2008.
million and spend more than $700 million in new pollution controls that will help protect public health and resolve Clean Air Act violations at its St. The Clean Air Act requires major sources of air pollution to obtain such permits before making changes that would result in a significant emissions increase of any pollutant.
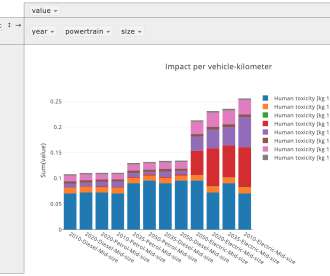
The user also selects the country where the vehicles are to be used—because this differentiates the electricity mix for electric cars—as well as the year, between 2000 and 2050, when the cars will be registered. For the future, the electricity mix can also be manually entered to test the effects of different scenarios.
The authors, under the umbrella of the Global Carbon Project , reported a 29% increase in global CO 2 emissions from fossil fuel between 2000 and 2008 (the latest year for which figures are available), and by 41% between 2008 and 1990, the reference year of the Kyoto Protocol. between 2000 and 2008, compared with 1% per year in the 1990s.
The dual-fuel diesel-biomethane powered bus is expected to reduce pollutant emissions and greenhouse gas emissions by around a half. The vehicle can still run on diesel, providing flexibility, but most of the time is running on biomethane gas which is a much cleaner and less polluting fuel. Dual-fuel use is a very attractive option.
Ozone levels across much of North America and Europe dropped significantly between 2000 and 2014. In some parts of Asia, Africa and South America, the researchers identified data gaps which prevented them from characterizing ozone pollution exposure patterns. Source: University of Leicester. Click to enlarge. TOAR is not just a report.
Since 2000, the group has reduced the fuel consumption of its TDI and TSI engines by more than 30%. On this basis the Volkswagen Group was working towards its declared objective of lowering the European new car fleet’s CO 2 emission level to 95 g of CO 2 /km by 2020. Earlier post.).
The data shows a slight increase in overall emissions from the previous year, and a slight decline in emissions from transportation, which is the state’s main source of both GHGs and air pollutants. CARB has approved additional measures to reduce emissions of greenhouse gases from super pollutants that must also be reduced significantly.
The collaborative study between government, non-government, university and community partners will collect both airborne and ground-based measurements to determine how air pollutants are transformed and transported across the landscape. Evaluate high-resolution air quality models for use in the oil sands region.
Rolls-Royce is planning to test a new MTU hybrid system incorporating Series 2000 engines in a yacht in 2019. With this program, the company is making targeted investments in environmentally friendly solutions for the future designed to reduce pollutant emissions and the consumption of both energy and raw materials.
Automobiles are major contributors to air pollution and greenhouse gas emissions. Further highlights from the report include: The passenger vehicle fleet in China grew at an annual average rate of 25% during 2000-11, from fewer than 10 million cars to 73 million cars. million EVs and a fleet of 3.5
Increasing engine speed from 2000 to 6000 rpm, indicated thermal efficiency decreases from 47% to 45% for the turbocharged case and from 46% to 44% for the naturally aspirated one due to higher pressure losses in the transfer phase. Pollutant emission behavior vs. engine speed.confirms the validity of the HCPC combustion concept.
Although the presence of microplastics in the environment is raising concerns, the amount of microplastics in air and water is small compared to another polymer that pollutes air and water: micro rubber. Since the year 2000, the guidelines for the recycling of water and the prevention of soil pollution have been significantly tightened.
Demand for plastics—the key driver for petrochemicals from an energy perspective—has outpaced all other bulk materials (such as steel, aluminium, or cement), nearly doubling since 2000.
While numerous studies have shown that air pollution is associated with cardio-pulmonary mortality, there has been less research into the possible effect of air pollution on stroke and non-fatal coronary events. Participants were selected over the time period from 2000 to 2003, and were aged between 45 and 74 years.
As in the past, Americans expressed the greatest worry about pollution of drinking water, and the least about global warming. Americans tend to give environmental concerns higher priority when the economy is healthy than when it is ailing, and in recent decades the US economy was arguably its strongest in late 1999 and early 2000.
million tons of carbon equivalents per year and an expected reduction in criteria pollutants of over 2,000 tons per year. The vehicles that will be deployed under this grant are based on Smith’s latest production model Series 2000, which has been fully deployed in several locations across the country.
Issues covered in the briefing include emissions, air pollution, noise and renewable energy and the impact of transport on ecosystems and biodiversity. It also continues to be a significant source of harmful air pollution, especially through emissions of nitrogen dioxide and particulate matter. Air pollution. in 2015 to 7.1%
As a result of their findings, published in the 30 October issue of the journal Science , the authors argue that assessments of multigas mitigation policies, as well as any separate efforts to mitigate warming from short-lived pollutants, should include gas-aerosol interactions. Radiative forcing by greenhouse gases from 1750 to 2000.
Emission rates of BC in the year 2000 by region, indicating major source categories in each region. Total global emissions of black carbon using bottom-up inventory methods are 7500 Gg yr -1 in the year 2000 with an uncertainty range of 2000 to 29000. Source: Bond et al. Click to enlarge. W m -2 (+0.17 W m -2 range).
This also implies underperformance in terms of economic and social benefits, such as reduction of pollution levels and congestion. Meanwhile, European cities need to enhance mobility and to reduce congestion, accidents and pollution through local mobility policies. billion (US$14.9 billion)—€2.9 billion (US$4 billion) and €7.8
New methods of testing and simulating air quality should be considered in order to help policy makers have a more accurate understanding of how emissions affect air pollution levels, new research suggests. The researchers compared current techniques used to describe atmospheric chemical reactions against more historical techniques.
We organize all of the trending information in your field so you don't have to. Join 5,000+ users and stay up to date on the latest articles your peers are reading.
You know about us, now we want to get to know you!
Let's personalize your content
Let's get even more personalized
We recognize your account from another site in our network, please click 'Send Email' below to continue with verifying your account and setting a password.


Let's personalize your content