This site uses cookies to improve your experience. To help us insure we adhere to various privacy regulations, please select your country/region of residence. If you do not select a country, we will assume you are from the United States. Select your Cookie Settings or view our Privacy Policy and Terms of Use.
Cookie Settings
Cookies and similar technologies are used on this website for proper function of the website, for tracking performance analytics and for marketing purposes. We and some of our third-party providers may use cookie data for various purposes. Please review the cookie settings below and choose your preference.
Used for the proper function of the website
Used for monitoring website traffic and interactions
Cookie Settings
Cookies and similar technologies are used on this website for proper function of the website, for tracking performance analytics and for marketing purposes. We and some of our third-party providers may use cookie data for various purposes. Please review the cookie settings below and choose your preference.
Strictly Necessary: Used for the proper function of the website
Performance/Analytics: Used for monitoring website traffic and interactions
Ozone levels across much of North America and Europe dropped significantly between 2000 and 2014. People living in parts of southern Europe, South Korea and southern Japan and China also experienced more than 15 days a year of ozone levels above 70 ppb. Source: University of Leicester. Click to enlarge.
US EPA Region 9 8-hour ozone trends, 1979-2000. These State Implementation Plans (SIPs) are the roadmaps to meeting the 1997 8-hour ozone National Ambient Air Quality Standards (NAAQS) of 0.08 In 1997, EPA first established the 8-hour ozone standard, which replaced the older 1-hour ozone standard (0.12 Source: EPA.
Net warming from NO x emissions is a sum over warming (short-term ozone increase) and cooling (decreases in methane and stratospheric water vapor, and a long-term decrease in ozone) terms. Both radiative forcing (RF) and effective radiative forcing (ERF) terms and their sums are calculated for the years 2000–2018. Pitari, M.J.
The decrease in CO 2 equivalent emissions of ODSs (ozone-depleting substances: CFCs, halons, HCFCs, and others) may be offset by the projected increase in their non-ozone depleting substitutes (HFCs) (lines designated as HFC scenarios). W m -2 relative to 2000. Climate and the Ozone Layer. Source: UNEP. Click to enlarge.
Since 1990, nationwide air quality has improved significantly for the six common air pollutants: ground-level ozone; particle pollution; lead; nitrogen dioxide; carbon monoxide; and sulfur dioxide, according to the US Environmental Protection Agency (EPA) report “Our Nation’s Air - Status and Trends through 2008”. since 2000), by 19%.
The existing US NO x cap-and-trade program lowered 2008 summertime NO x emissions from power plants and large industrial sources 62% compared to year 2000 levels and 75% lower than in 1990, according to a report released by the US Environmental Protection Agency (EPA). State level ozone emissions in the NBP, from 1990 to 2010 (projected).
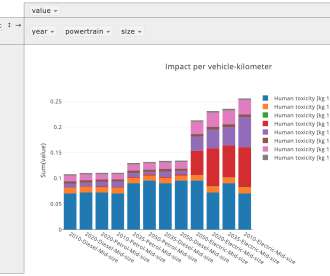
Deterioration of the ozone layer [kg CFC-11-eq.]. The user also selects the country where the vehicles are to be used—because this differentiates the electricity mix for electric cars—as well as the year, between 2000 and 2050, when the cars will be registered. Depletion of fossil energy resources [kg oil-eq.].
Radiative forcing due to perpetual constant year 2000 emissions grouped by sector for 2020 (left) and 2100 (right) showing the contribution from each species. The net sum of total radiative forcing is indicated by the title of each bar. From Unger et al., Click to enlarge. Unger et al.
Global average values for the year 2000. Findings for freight transport (year 2000) include: The specific climate impact of air transport is 3 to 42 times higher, for a light truck it is 2 to 8 times higher than average truck transport. Bars represent 1 SD. Credit: ACS, Borken-Kleefeld et al. Click to enlarge.
HFCs are powerful greenhouse gases originally developed as substitutes for ozone-depleting chemicals. A binding legal agreement exists that can cut HFCs now—the Montreal Protocol ozone treaty—and many alternatives to HFCs have already been developed and are waiting for the right regulatory incentive from the Montreal Protocol to be deployed.
DOE selected this project to improve local air quality in the Houston-Galveston area, which is currently designated as a National Ambient Air Quality Standards (NAAQS) 8-hour ozone non-attainment area. Each Smith Newton will be delivered with an electric vehicle charging station (EVSE).
And hydroxyls drive long chains of reactions involving other common gases, including ozone. That’s noteworthy because nitrogen oxides have primarily been associated with ozone formation and warming in the past. Radiative forcing by greenhouse gases from 1750 to 2000. Similar reactions influence the creation of nitrate aerosols.
per year from 2000-2007. For 30 reference glaciers in nine mountain ranges tracked by the World Glacier Monitoring Service, the mean rate of loss since 2000 has roughly doubled since the rate during the previous two decades. Global emissions were growing by 1.1% each year from 1990-1999 and this accelerated to 3.5%
Global ozone-depleting substances (ODSs) and HFC emissions (A), global CO 2 and HFC emissions (B), and ODS, HFC, and CO 2 global RF (C) for the period 2000–2050. These HFCs, gases used in refrigerators and air conditioners, are substitutes for ozone-depleting gases, but they are also strong greenhouse gases. Velders et al.
giga tonne carbon dioxide equivalent (GtCO 2 eq) (2.2%) per year from 2000 to 2010 compared to 0.4 GtCO 2 eq (1.3%) per year from 1970 to 2000. Total anthropogenic GHG emissions were the highest in human history from 2000 to 2010 and reached 49 (±4.5) GtCO 2 eq/yr in 2010. benefits in the short term.
Houston, with a mix of petrochemical facilities, sprawling suburbs, and traffic jams that stretch for miles, has some of the highest levels of ground-level ozone and other air pollutants in the United States. The article is in press in the Journal of Geophysical Research-Atmospheres , a publication of the American Geophysical Union.
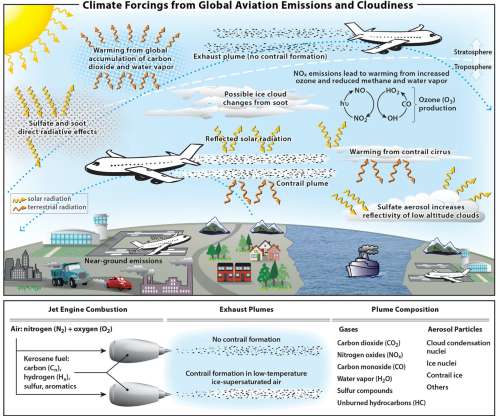
In addition to CO 2 , other compounds such as ozone (O 3 ) precursors (nitrogen oxides (NO x =NO+NO 2 ), carbon monoxide (CO), and volatile organic compounds (VOCs)) and aerosols such as black carbon (BC) and organic carbon (OC) are emitted by ships. 1 from shipping in 2007, corresponding to 3.3% 1 of the total ship emissions in 2007.
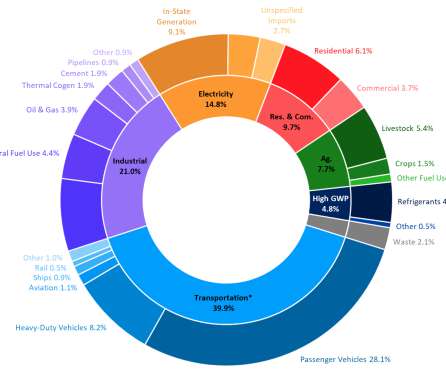
Changes in emissions by Scoping Plan sector between 2000 and 2017. Emissions from all other sectors have remained relatively constant in recent years, although emissions from high Global Warming Potential (GWP) gases have continued to increase as they replace Ozone Depleting Substances (ODS) banned under the 1987 Montreal Protocol.
in 2018 (2000-2018 average year-over-year increase is 6.8%), continuing the increasing trend as they replace Ozone Depleting Substances (ODS) being phased out under the 1987 Montreal Protocol. Per capita GHG emissions in California have dropped from a 2001 peak of 14.0 tons per person to 10.7 tons per person in 2018, a 24% decrease.
The downward emission trend of three main pollutants which cause ground-level ozone continued in 2007: carbon monoxide (CO) fell by 57%, non-methane volatile organic compounds (NMVOCs) were down by 47% and nitrogen oxides (NO x ) have dropped 36%. EU-27 emissions of all four pollutants were lower in 2007 than in 2006.
concentrations in the US fell by 39% between 2000 and 2018 while average PM 10 concentrations fell by 31% during the same period. EPA is proposing that the current secondary standards are adequate to protect against PM-related visibility impairment, climate effects, and effects on materials. Average PM 2.5
Further, the agency said, technical progress has been made in developing technologies and approaches that can reduce NO x emissions beyond the standards put in place in the 2000 rule. (In the final HD Phase 2 rule, EPA had noted the evidence supporting the need for more stringent national NO x emissions standards.).
Between 2000 and 2011, the number of producing gas wells in the US increased by 50%, reaching 514,637. Air emissions from the natural gas life cycle include greenhouse gases, ozone precursors (volatile organic compounds and nitrogen oxides), air toxics, and particulates. Moore et al.
They focused their comparison on techniques used in a three-dimensional model commonly used by environmental agencies to simulate ozone, particulate matter, and atmospheric acid concentrations, and develop effective emission reduction strategies.
Here, RME show advantages for primary energy and GHG, but disadvantages in terms of acidification, eutrophication and ozone depletion. World ethanol production for transport fuel tripled between 2000 and 2007 from 17 billion to more than 52 billion liters (13.7 Source: “Assessing Biofuels”. Click to enlarge.
In 2000, the ARB established California’s Diesel Risk Reduction Plan, which aims to reduce diesel emissions to 85% below 2000 levels by 2020. NO x helps create ground-level ozone, or smog. BNSF has been operating four liquefied natural gas yard locomotives in downtown Los Angeles since the mid-1990s.
Most of this infrared radiation passes through the atmosphere, but some is absorbed by GHG molecules like CO 2 , methane, ozone and others. Based on recent emissions inventories (2000 for global and 2005 for the United States), the majority of global BC emissions come from Asia, Latin America, and Africa. Source: EPA.
Methyl halides are naturally produced by a number of organisms; the enzyme responsible for this production—methyl halide transferase (MHT)—has been studied in the context of the environmental production of methyl halides, which contribute to ozone depletion. Santi and Christopher A. Voigt (2009) J. Redeker, N.-Y. McMillan, S.
Research data included 11,390 emergency room visits and hospital admissions made by 7,954 children ages 0 to 18 between 2000 and 2008. and ozone in warm months, and with PM 2.5 , carbon monoxide, nitrogen dioxide and oxides of nitrogen in the cool season. Hospital encounters for asthma were linked to PM 2.5
California has already cut anthropogenic black carbon emissions by more than 90% since the 1960s, and existing measures are projected to cut mobile source emissions by 75% and total anthropogenic emissions by nearly 60% between 2000 and 2020. The SLCP Strategy is due to come before the Board for consideration in March 2017.
Ozone pollution across the continental United States will become far more difficult to keep in check as temperatures rise, according to new work led by the National Center for Atmospheric Research (NCAR). Ozone formation. Even short periods of unhealthy ozone levels can cause local death rates to rise. Scenario A2 and RCP 8.5.
Reducing emissions of black carbon soot and ground-level ozone would quickly make a considerable dent in the climate change problem and would also contribute to public health and protect crop yields, according to an essay in the September/October issue of Foreign Affairs. Besides a danger to breathe, ozone lowers crop yields.
Im gonna post a couple excerpts here: Most ozone pollution is caused by motor vehicles, which account for 72% of nitrogen oxides and 52% of reactive hydrocarbons (principal components of smog). (7, 1, 2000) Sited: [link] You can google it and find it anywhere that vehicles have always placed more harmful chemicals into the air.
Long-term exposure to ambient air pollutants, especially O 3 (ozone), is significantly associated with increasing emphysema, according to a new study led by the University of Washington, Columbia University and the University at Buffalo. The annual averages of ozone levels in study areas were between about 10 and 25 ppb.
1,000 to 21,000) deaths due to changes in ozone concentrations. 900 to 11,000) ozone-related early deaths per year. 300 to 4,000) ozone-related premature mortalities per year. 2000 (90% CI: 0–4,000) early deaths from ozone, according to the study. 53,000 (90% CI: 24,000–95,000) PM 2.5 related premature deaths and
million metric tons of avoided ozone-related yield losses of major food crops; $US0.6-2.4 Impacts of worldwide vehicle emissions in 2030 compared with 2000. While reductions in particulate matter tend to produce local health benefits, the scientists found health and agricultural benefits from reduced ozone disperse more widely.
20 % of stations registered concentrations above the EU ozone (O 3 ) target value for the protection of human health. The percentage of the EU-28 urban population exposed to O 3 levels exceeding the WHO AQG value was 96% in 2017—showing scarcely any fluctuation since 2000.
Ozone, another important component of outdoor air pollution, whose levels are on the rise around the world, contributed to 234,000 deaths from chronic lung disease. Population-weighted seasonal average ozone concentrations in 2016. Worldwide exposure to PM 2.5 contributed to 4.1 State of Global Air 2018.
Jacobson first showed in 2000 that black carbon was the second-leading cause of global warming after carbon dioxide in terms of radiative forcing and, in 2002, that its control was the most effective method of slowing warming. F, with about 40% due to ozone. These additional deaths are occurring today ,” he said.
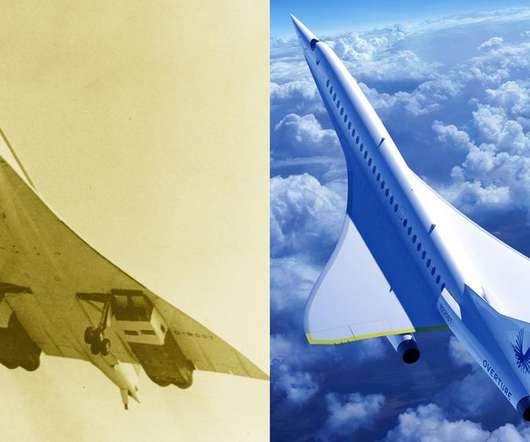
Meanwhile, environmentalists were voicing concern—about how noisy such aircraft are taking off, about the possibility that their high-altitude emissions would erode the ozone layer, and about how disruptive the sonic booms would be. Fourteen production aircraft were manufactured, but one was scrapped in 1994 and another crashed in 2000.).
Global trends in vehicle-kilometers traveled (VKT) and early deaths from vehicle-related fine particle exposure (2000–2030). Next-generation standards would target new reductions in emissions of NO x and non-methane hydrocarbons (HC), which are precursors to ozone and secondary particulate matter. Chambliss et al. Click to enlarge.
We organize all of the trending information in your field so you don't have to. Join 5,000+ users and stay up to date on the latest articles your peers are reading.
You know about us, now we want to get to know you!
Let's personalize your content
Let's get even more personalized
We recognize your account from another site in our network, please click 'Send Email' below to continue with verifying your account and setting a password.


Let's personalize your content