Remove 2000 Remove Climate Remove Coal
article thumbnail

USA & China Electricity Generation TWh & CO2e Trajectories Since 2000 Are Startling

CleanTechnica EVs

continued] The post USA & China Electricity Generation TWh & CO2e Trajectories Since 2000 Are Startling appeared first on CleanTechnica. For a decade I’ve been tracking the exponential expansion of wind, solar, and to a lesser extent hydro electricity generation.

2000 97
article thumbnail

IEA: CO2 emissions from fuel combustion rose 2.2% in 2013, below the average rate since 2000

Green Car Congress

Both years were below the average growth rate since 2000 of 2.5%. IEA’s preliminary assessment for the World Energy Outlook Special Report on Energy and Climate published in June estimated that global energy-related CO 2 emissions were flat in 2014. in 2013 to total 32.2 gigatonnes, compared with the 0.6% increase in 2012.

2000 150
article thumbnail

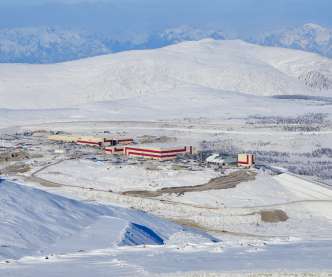
Udokan Copper to cut carbon intensity of copper production up to 75% by 2035

Green Car Congress

Russia-based Udokan Copper , the developer of Russia’s largest new copper deposit, outlined scenarios to cut the carbon intensity of copper production up to 75% by 2035, bringing the company closer to its ultimate goal of climate neutrality in the long run. In 2021, Udokan Copper invested RUB 764 million (US$11.5 Geologiya i Geofizika.

Carbon 273
article thumbnail

MIT report finds China’s actions on climate change crucial; argues for global economy-wide greenhouse gas tax

Green Car Congress

The report—titled “The Role of China in Mitigating Climate Change” and published in the journal Energy Economics , compares the impact of a stringent emissions reduction policy with and without China’s participation. From 2000 to 2010, China’s energy use grew 130%, up from a growth of 50% the previous decade.

article thumbnail

Study concludes abundant shale gas is neither climate hero nor villain; need for targeted GHG reduction policy

Green Car Congress

Shale gas in particular has grown rapidly, from less than one percent of US production in 2000 to 34% in 2012, and projections show strong production growth continuing for the foreseeable future. In this paper, we focus on the implications of growing shale gas production for the climate. —Newell and Raimi.

Climate 199
article thumbnail

Study finds that worldwide SO2 emissions rose between 2000-2005 after decade of decline; China, shipping topped growth

Green Car Congress

Global sulfur dioxide (SO 2 ) emissions peaked in the early 1970s and decreased until 2000, with an increase in recent years due to increased emissions in China, international shipping, and developing countries in general, according to a new analysis appearing in the open access journal Atmospheric Chemistry and Physics.

2005 186
article thumbnail

Study projects thermoelectric power in Europe and US vulnerable to climate change due to lower summer river flows and higher river water temperatures

Green Car Congress

Projected changes in summer mean usable capacity of power plants in the US and Europe for the SRES A2 emissions scenario for the 2040s (2031–2060) relative to the control period (1971–2000). A study published in Nature Climate Change suggests that thermoelectric power plants (i.e., Source: van Vliet et al. Click to enlarge.